Flip Side of the Coin: Can this be a turning point in the battle against climate change?
COVID-19 measures around the world disrupted the economy, but also positively impacted the environment as slowing industrial activity reduced its CO2 emissions. In this data story, the European Data Portal examines how CO2 emissions from industries, in particular the energy industry, changed due to COVID-19.
COVID-19 measures around the world caused disruption and posed significant burdens on our economies. However, the flip side of the coin is that these measures also positively impacted our environment, by reducing the emissions of carbon dioxide (CO2) and other pollutants - such as sulphur dioxide (SO2) and nitrogen oxides (NOX) – from numerous sectors, such as transport, energy and aviation. Reduced pollutant emissions result from, for instance, lower demand for services, closing of large buildings such as offices and schools, and a reduction of industrial activity. These events are in no way an achievement to aim for. However, the situation that arose is worth analysing to determine what we could learn from it, for when things go back to some degree of normality.
In this data story, the European Data Portal Team examines the positive environmental impact of COVID-19 by assessing how the pandemic resulted in decreased CO2 emissions, specifically from the energy industry. The causes for reduced CO2 emissions are elaborated upon by examining changes in demand for the energy industry’s production. Furthermore, the data story touches upon the effects of COVID-19 in terms of a shift towards more sustainable energy sources.
Though this data story focuses exclusively on CO2 emissions from the energy industry, the effects of COVID-19 on air pollution caused by the transport and aviation sectors are addressed in another data story by the European Data Portal Team.
CO2 emissions worldwide decreased significantly due to COVID-19
The Integrated Carbon Observation System provides data on COVID-19-related change in CO2 emissions from fossil fuels. For example, the observed reduction in CO2 emissions in comparison to the same period in 2019 is visualised for the EU and UK, as well as on a global level in figure 1 below.
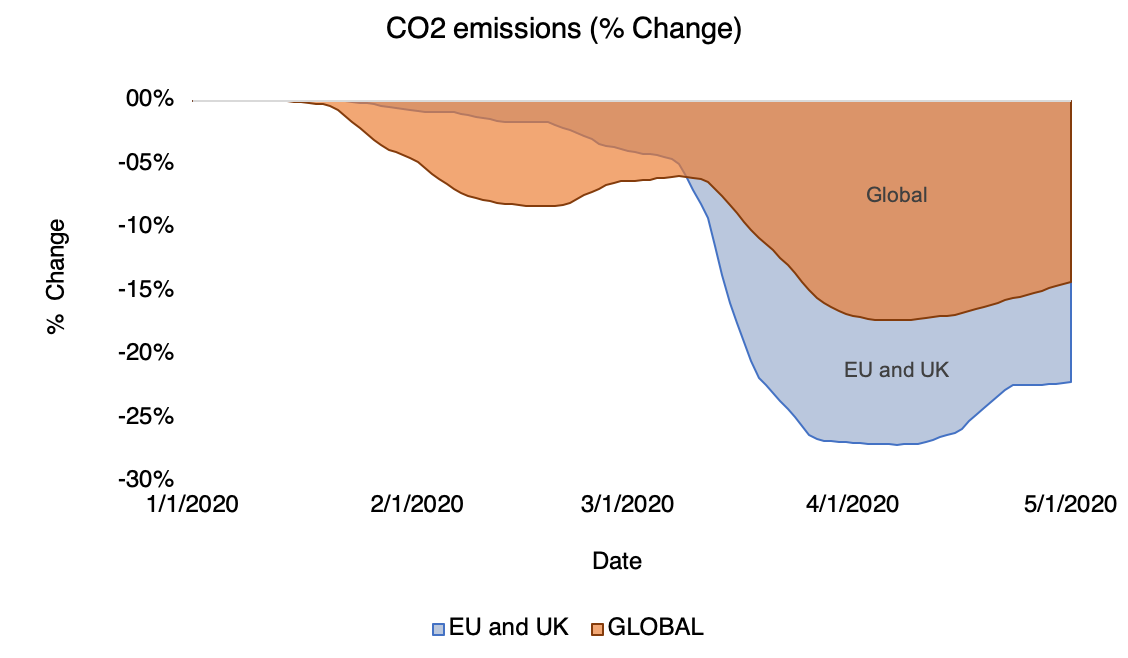
Figure 1: Percentual change in daily fossil fuel CO2 emissions from January to May 2020 in comparison to January to May 2019. Source: Integrated Carbon Observation System
The figure highlights that a decrease in CO2 emissions from fossil fuels was visible on a global level before changes were evident in EU and UK CO2 emissions. This finding can be explained by the fact that COVID-19 first appeared in China and gradually spread across the world, moving its epicentre in phases from Asia, towards Europe and America.
At its lowest point in April 2020, daily global CO2 emissions decreased by 17%, in comparison to its benchmark one year earlier. However, CO2 emissions in the EU and UK decreased to a larger extent during the same time period, showing a 27% decrease.
Stringent government measures restricted global industrial activity
The swift and global spread of COVID-19 led governments to take stringent measures, one of them being shutting down offices and factories to prevent contagion at the workplace. This created a shock on the global economy and concerned industry experts, since it was the biggest episode of this kind since World War II.
From January 2020 onwards, when China acknowledged its first COVID-19 cases and started taking large scale action, industrial production fell dramatically, with a decline of 50% in automobile production and 30% in cement production during the first two months. When COVID-19 spread to Europe in February and the lockdown measures were implemented in March, the industrial activity contracted strikingly, as illustrated by data from Eurostat (figure 2).
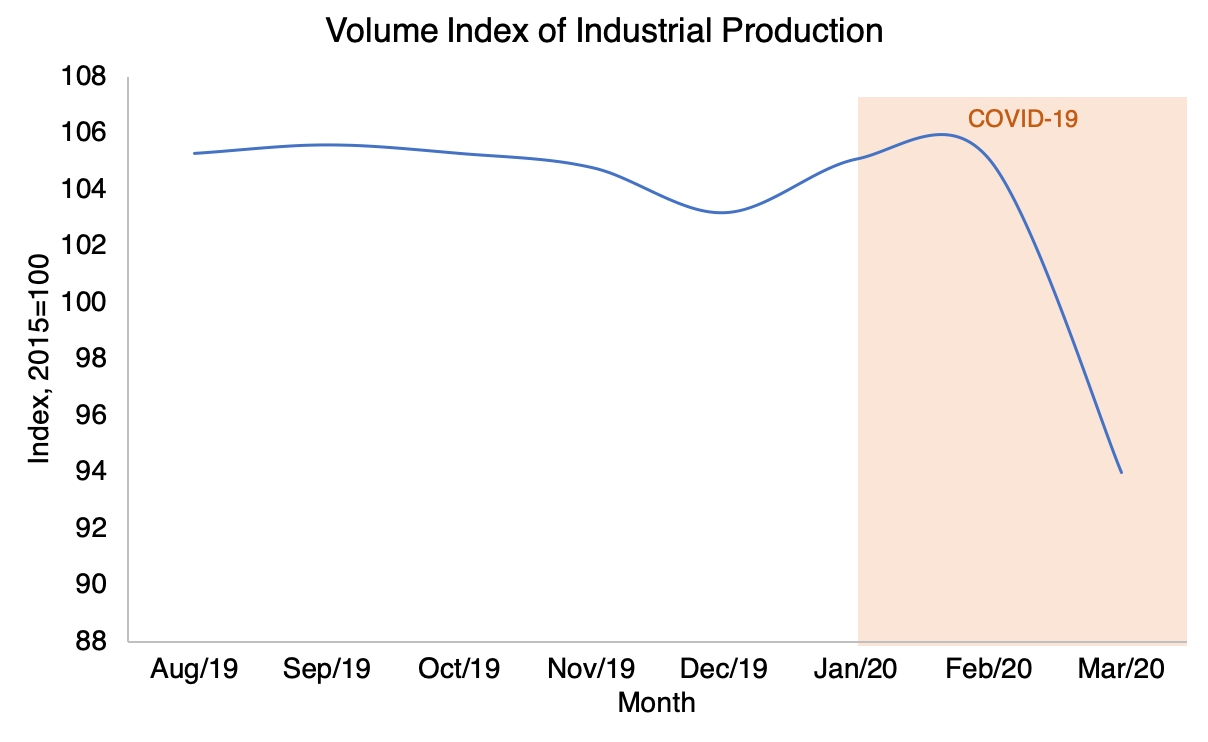
Figure 2: Volume Index of Industrial Production. Source: Eurostat
The unexpectedly fast spread of COVID-19 disrupted activities in all industries, from manufacturing to supply chain networks. Car production suddenly halted, industrial manufacturing companies faced supply chain disruptions and aerospace manufacturing slowed down since air carriers reduced their flight schedule by 60-95% due to air travel restrictions.
As a positive consequence, the industrial pollutant emission numbers decreased massively. While the slower industrial activity presents its economic challenges, it also enabled the environment to partially recover and now offers the opportunity to build a more sustainable future.
Decline in energy demand positively impacted CO2 emission
Government policies concerning the lockdowns altered the global energy demand patterns. The energy industry is experiencing the biggest decline in 70 years with an expected 6% fall in the energy demand in 2020. The magnitude of what we are experiencing is equivalent to seven times the impact of the financial crisis in 2008.
In Figure 3, created by the International Energy Agency (IEA), the massive impact of restrictions on industrial and commercial activities can be observed. The lockdown measures first implemented in China in late January caused the impact on energy demand to be visible immediately, as the country is responsible for a large part of energy demand, accounting for 24% in 2019. Lockdown measures were subsequently implemented by India and European countries in March and by the United States in April, which resulted in a huge slump from 5% to 52%, since the US population is responsible for 53% of the global primary energy consumption.
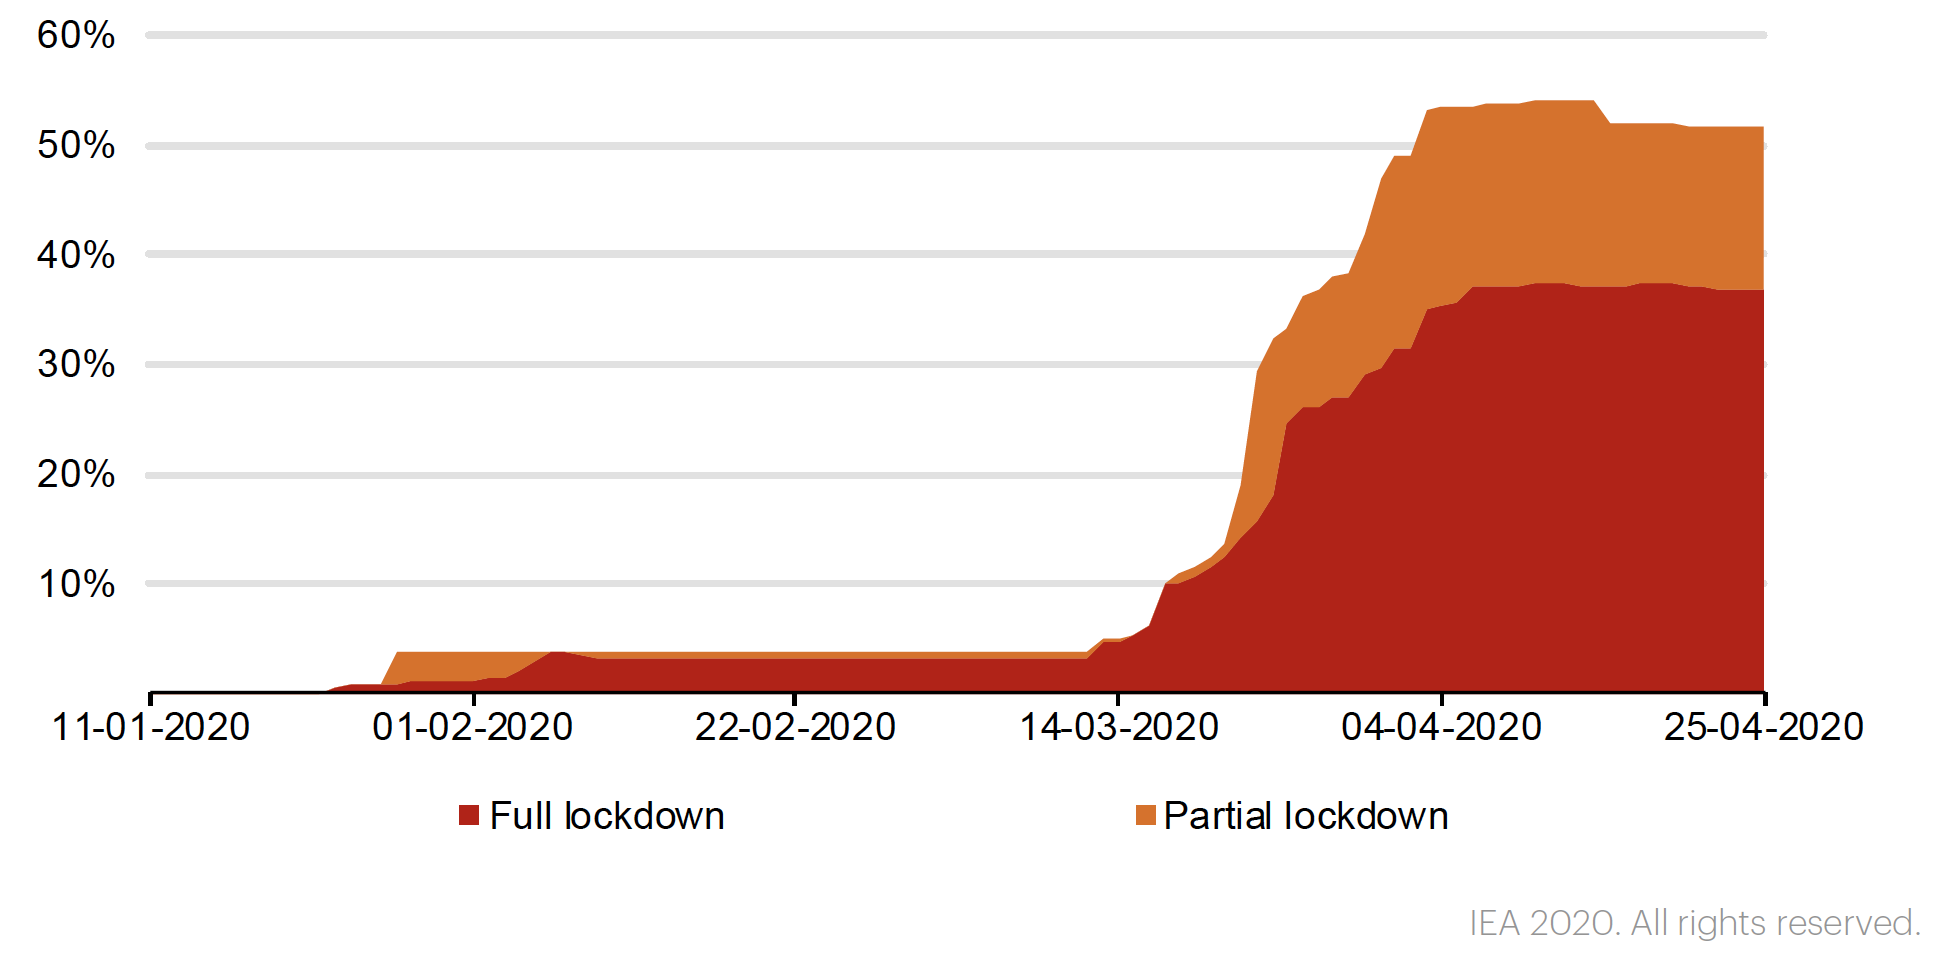
Figure 3: Share of global primary energy demand affected by mandatory lockdowns. Source: IEA
The decrease in the global energy demand, correlates with reduction in the CO2 emissio. Historically, global crises mark the lower energy demand hence lower CO2 emissionn rates (figure 4). The slowdown of economic activity during COVID-19 cut down the usage of energy sources, such as coal, oil, gas and electricity by 3.8% in the first quarter and projected to drop by 6% in 2020, results with 2.6Gt reduction in CO2 emission. When comparing COVID-19 with the financial crisis in 2008, the drop in CO2 emissions during the financial crisis was followed by a drastic rebound in emissions. This highlights an important lesson for the current crisis with regards to being mindful about potential increases of emission levels after the worst impacts of COVID-19.
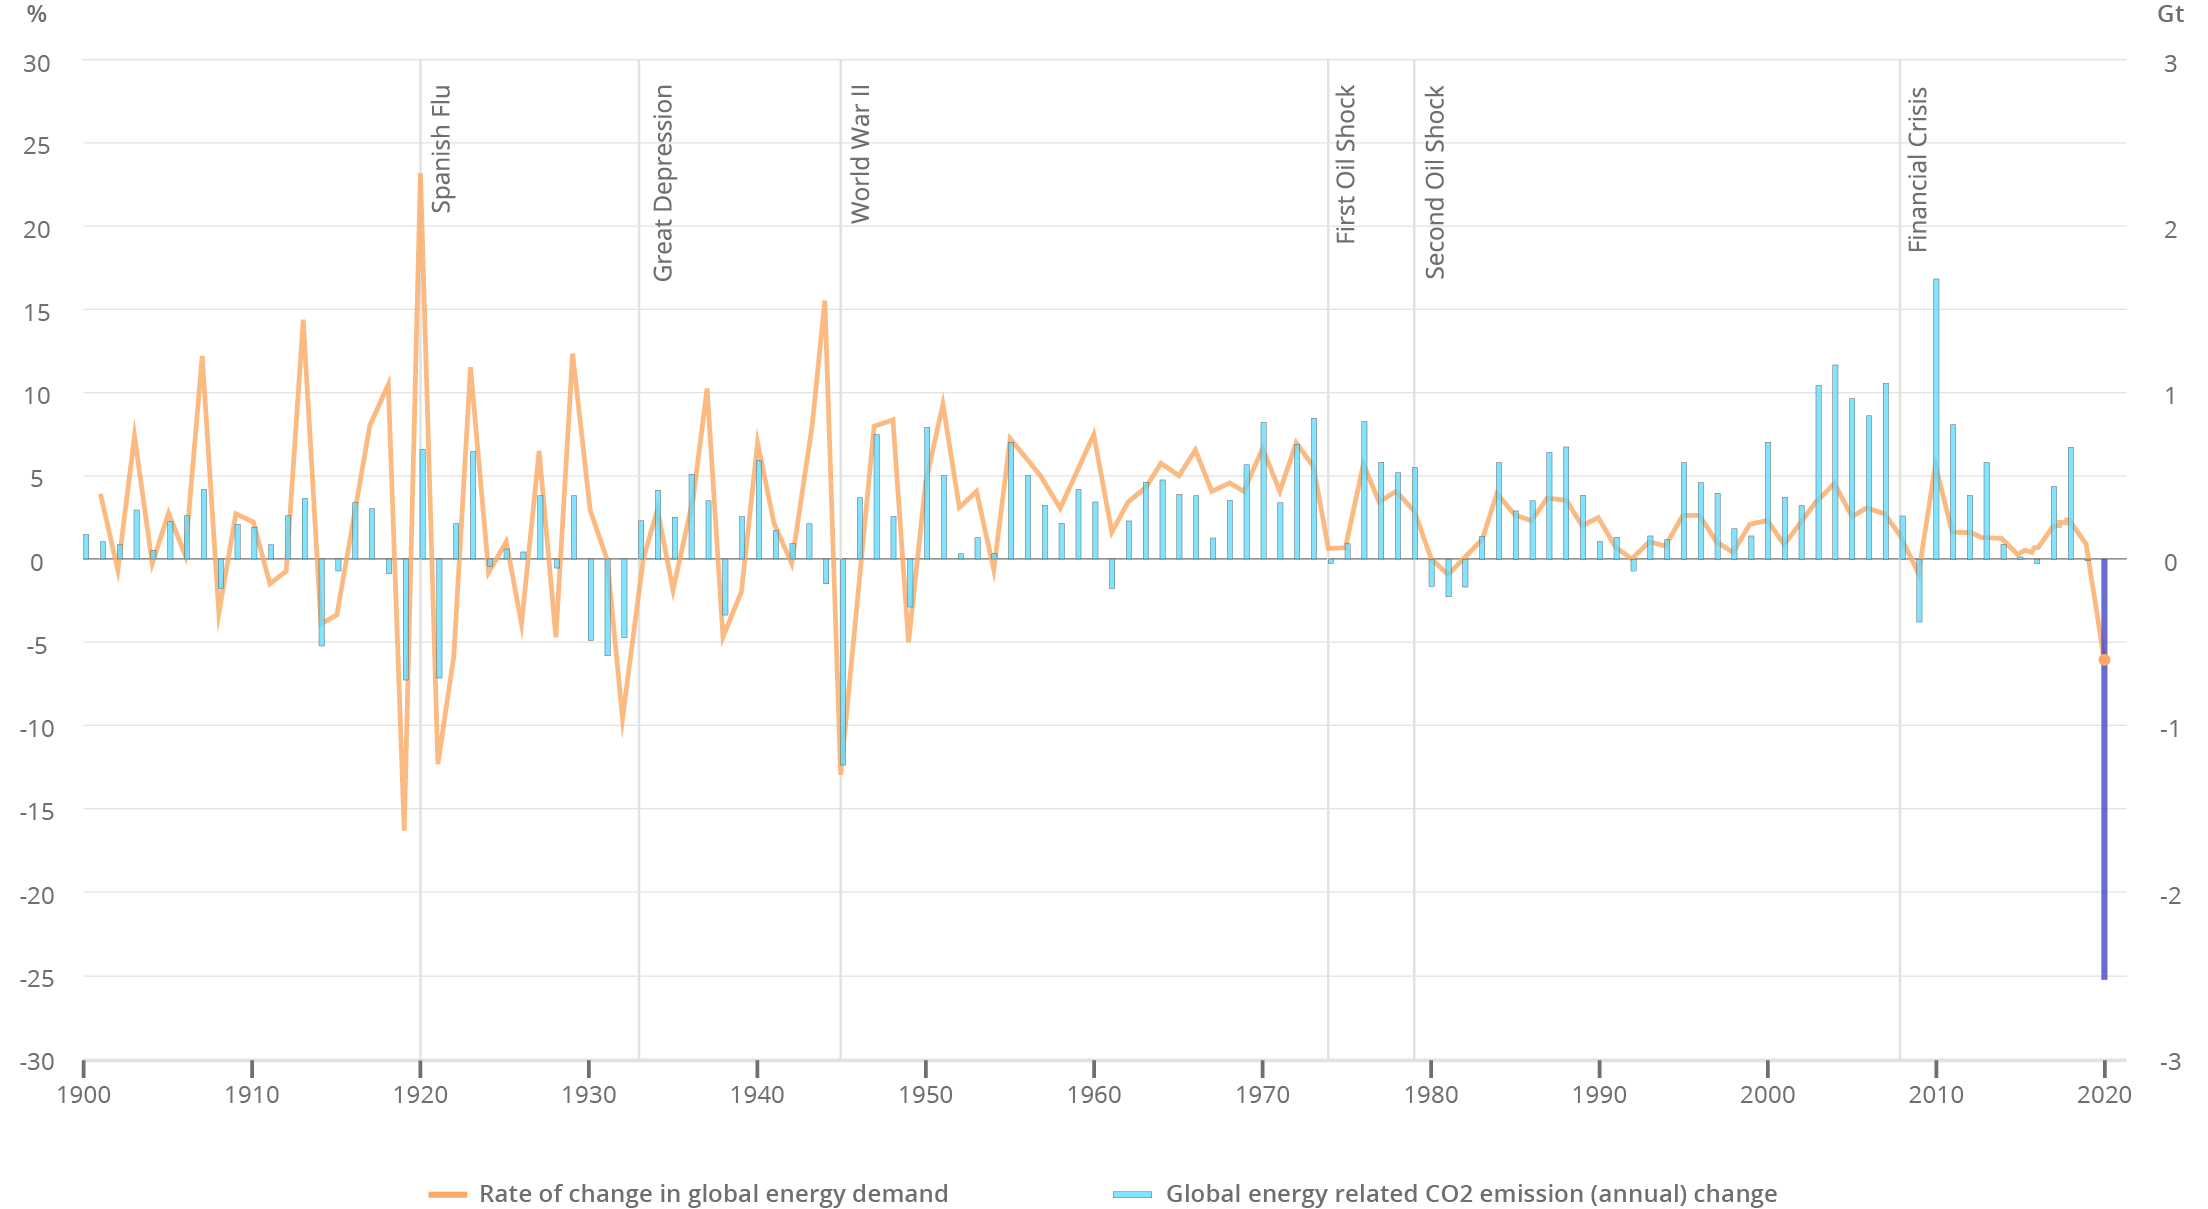
Figure 4: Rate of change in global energy demand compared to the annual CO2 emission change. Source: IEA
Reduced demand resulted in a reduction in energy prices
As a result of the large decrease in energy demand, energy prices decreased sharply in the first quarter of 2020, as illustrated by data on price indices from the World Bank in Figure 5.
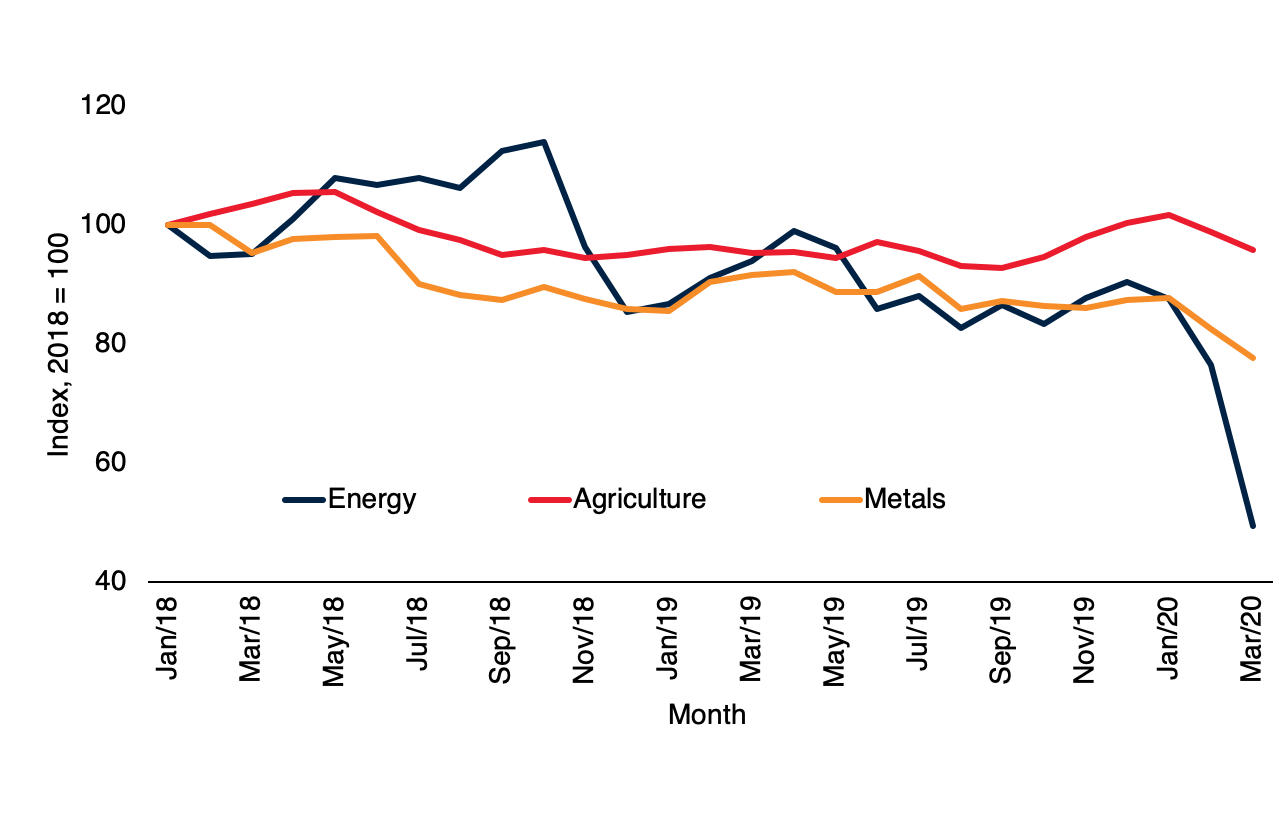
Figure 5: Price indices for energy, agriculture and metal commodities from January 2018 to March 2020 (Index values represented in the vertical axis are initialized to 100 as of 1st January 2018). Source: World Bank
The figure illustrates that during the first quarter of 2020, the price index for energy dropped 44.3% from its pre-COVID level of 88 in January 2020 to 49 in March 2020. Over the whole of 2020, expectations are that energy prices will average out 40% lower than in 2019. In comparison, metal prices are projected to fall 13% over 2020, whereas agricultural prices are expected to remain broadly stable. Hence, energy prices are suffering the most from COVID-19, followed by metal, whereas agricultural commodities seem to be the more resilient to changes in economic activity than the industrial commodities.
COVID-19 accelerates the shift towards low-carbon and renewable energies
COVID-19 not only brought about decreased CO2 emissions from energy due to a lower demand, but also highlights an increasing demand for renewable energy. When considering the projections for changes in demand per fuel in 2020 in figure 6, the IEA predicts that energy demand for coal was hit the hardest by COVID-19 as a result of restrictions on industrial activity. This reduction in demand for coal is beneficial, as coal usage is solely responsible for 46% of the global CO2 emission. Oil demand also decreased as a result of international travel bans and low economic activity, leading to further reduction in the carbon footprint.
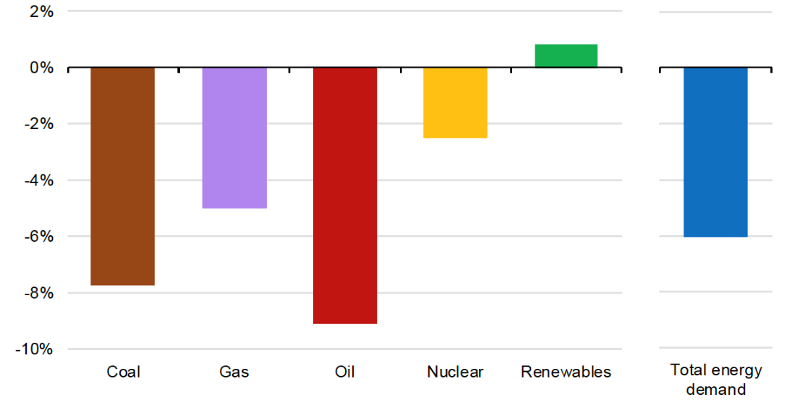
Figure 6: Projected change in primary energy demand by fuel in 2020, compared to 2019. Source: IEA
In total, the IEA expects total energy demand to decrease by 6% over 2020. Nonetheless, demand for renewables is expected to increase in 2020, partially due to the successful solar project outcomes from last year. This rise in demand for renewables will contribute to an increasing share of low-carbon energy sources in the mix hence benefiting the environment.
Another example of how a shift in energy sources is taking place is when considering electricity generation from low-carbon technologies, in comparison to coal. IEA research highlights that low-carbon technologies first accounted for a larger share of global electricity generation than coal in the year 2019, as illustrated by figure 7.
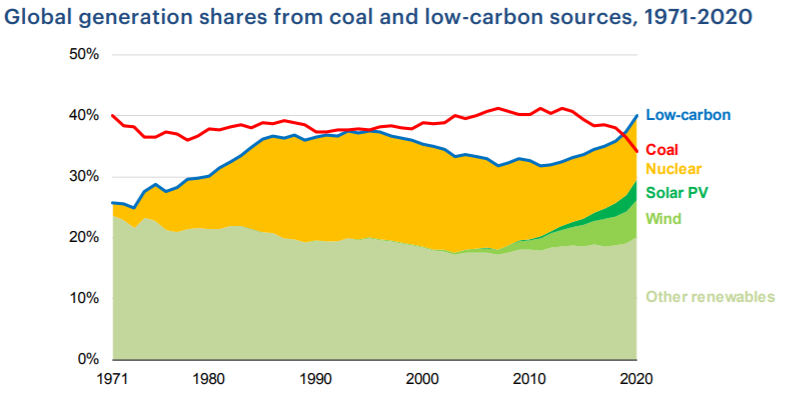
Figure 7: Global generation of electricity in shares, from coal and low-carbon sources, from 1971 to 2020 (predicted for 2020). Source: IEA
In 2020, this trend is expected to continue, as the IEA calculates low-carbon to account for 40% of the global generation of electricity, compared to a 34% share for coal due to the lowered economic activity as a result of lockdowns. Similarly to energy demand above, an important factor in the accelerated increase of the share of electricity generated from low-carbon sources is that global energy generation is expected to fall with 5% in 2020.
Even though COVID-19 positively impacted CO2 emissions, more efforts are required
COVID-19 has caused a global health crisis with a tragic impact on people’s lives. In order to contain the virus, societies and economies have taken unprecedented measures. On the other side, these measures resulted in a significant reduction of pollutant emission levels. However, the decrease in CO2 emissions is expected to be temporary, as once lockdowns and restrictions across the world are lifted, industrial activity will increase and CO2 emission levels may swiftly rebound towards pre-COVID-19 levels – something that can be already observed for air pollution in China.
Larger shifts towards low-carbon energy sources are required to minimise the negative effects of climate change and ensure liveability in most countries. Therefore, COVID-19 gave us an opportunity to illustrate that we have the ability to reduce the harm we cause to the environment, however the change towards more sustainable practices needs to be progressed and be a priority when the countries restart.
Through data, we could witness the sudden impact of COVID-19 and related reduction in CO2 emissions. This ability emphasises the importance of open data in documenting the phenomena, creating awareness and triggering action towards more sustainable economies.
Disclaimer: The analysis for figures 1 and 2 was conducted across 69 countries, 50 US states and 30 Chinese provinces. These countries together represent 85% of the world population and 97% of global CO2 emissions.
Contact form: https://www.europeandataportal.eu/en/feedback/form
Looking for more open COVID-19 related datasets or initiatives? Visit the EDP for COVID-19 curated lists and follow us on Twitter, Facebook or LinkedIn.
