Looking back at the EU DataViz 2019
Discover what was discussed at the EU DataViz 2019 event on 12 November in Luxembourg
The EU DataViz 2019, organised by the Publications Office of the European Union, took place at the European Convention Center in Luxembourg on 12 November. The event brought together more than 500 international experts, professionals, and solution-seekers from around the world and addressed the specific needs of the public sector data visualisation community. Several European Directorate Generals (DGs) and services of the European Commission were actively involved with presentations, keynote speeches, and moderation of thematic sessions.
The EU DataViz 2019 programme featured inspirational plenary speeches, parallel workshops and thematic sessions that discussed topics such as:
- Data visualisation for communication purposes;
- Data exploration;
- Building smart cities; and
- Tools and best practices for data visualisation.
Missed the event? Do not worry, all presentations and recordings of the main sessions will be published on the conference website soon.
European Data Portal
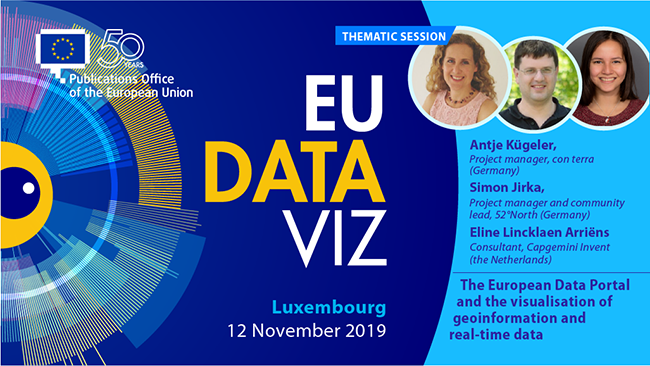
The European Data Portal (EDP) was present at the EU DataViz 2019 to highlight the value of open data at the thematic session "Exploring geospatial data". In our talk "The European Data Portal and the visualisation of geoinformation and real-time data", we highlighted:
- That the EDP aims to increase the impact of open data by making open data easy to find and re-useable for everyone;
- How the EDP acts as a single point of access to harmonise all data and remove barriers in finding data;
- The importance of accurate and regularly updated data for effective data visualisation;
- A preview of how geodata can be visualised on the EDP;
- What type of real-time data is available on the EDP; and
- A preview of how real-time data can be visualised on the EDP.

Figure 1: The European Data Portal and the visualisation of geoinformation and real-time data
Webinar on data visualisation
Interested in data visualisation but missed the event? Watch the Publication Office of the European Union's webinar on data visualisation. The webinars are on:
- Guidelines for effective data visualisation - focusing on pitfalls of data visualisation design, how to choose a chart type for your visualisation, what the Data Visualisation Checklist contains and a demo on the Chartmaker Directory tool.
- Telling your story through data visualisation - discover journalistic techniques for data storytelling, the available data story patterns, genres and structures, how to achieve storytelling through chart designs and a demo on Fastcharts, Datawrapper and Flourish tools.
- Going beyond bars and lines: practising non-standard data visualisations - focusing on visualisation in data analysis, different data types and visualisations that fit to them, how to introduce lesser known chart types to readers and a demo on ggplot and RAWgraph tools.
For more open data related events explore the European Data Portal's calendar. If you know of any upcoming open data events, share them with us via mail and follow us on Twitter, Facebook or LinkedIn to stay up to date!
