Thunder on the Financial Markets: A Retrospective View
Global financial markets have been severely disrupted by COVID-19. After a steep drop in March 2020, markets showed unexpected patterns in the following months. In this data story, the European Data Portal addresses the impacts of COVID-19 on the financial markets by referring to the trends witnessed in this period
Undoubtedly, the COVID-19 pandemic instilled fear among consumers, companies, and governments with regards to the magnitude of impact on economies across the world. In previous data stories the European Data Portal has already discussed how the COVID-19 crisis has affected the economy, covering specific topics such as consumer confidence, unemployment, and GDP growth.
Another market that is severely impacted by COVID-19 is the financial market, which experienced strong shocks worldwide. The performance of financial markets has a widespread impact on many areas such as employment, the sales of product and services, welfare benefits and living standards. Impact in these areas affects our daily lives in some form.
Various fiscal and monetary policies have been created by governments and central banks to quell the fear in the market and to facilitate economic recovery. The question is whether these efforts will be enough to mitigate the negative impacts of COVID-19.
In this data story, the European Data Portal elaborates on the impact of COVID-19 on the global financial markets and highlights some trends witnessed over the past weeks. Open data is a key input into the modelling and analysis that inform investment decisions. For instance, investors can enrich their analysis with data commonly publicly available from governments and companies, such as GDP and unemployment describing macro-economic aspects, and micro-economic trends, such as sector-wise supply and demand and corporate financial statements.
Global indices were severely hit by COVID-19 in March 2020
The COVID-19 virus was first recorded in Europe and the Americas around late February 2020. The speed at which the virus spread across these continents rapidly increased through March. As more and more cases were diagnosed and the reality of lockdowns in countries around the world set-in, investors became wary about the unusual uncertainty surrounding the financial markets.
This uncertainty was not only a result of the ongoing health crisis, but also of the outlook of an economic recession, contraction of GDP, rising unemployment levels, low industrial output, rapidly changing consumer trends and unpredictable corporate earnings.
We compare in figure 1 below the Year-To-Date (YTD) performance of global market indices S&P 500 (US), HANG SENG (Hong Kong) and EURONEXT 100 (pan-European). An index is a measurement of performance of a hypothetical portfolio of investment holdings that represents a segment of the financial market. Stock indices track the performance of the market and illustrate trends within the specific country or countries that the index refers to. The calculation of the index value is based on the prices of the underlying holdings. For example, the S&P 500 is a market-capitalisation-weighted index of the 500 largest U.S. publicly traded companies.

Figure 1: YTD comparison of the global stock indices; S&P500, HANG SENG and EURONEXT 100,
generated on 15th June 2020 by the European Data Portal Team using TradingView.
The figure illustrates how the indices evolved during the different phases of the COVID-19 crisis between January 2020 and 15 June 2020. The most remarkable event was a steep drop in March 2020, resulting from investors aiming to protect their investments and therefore hastily sell-off their assets. This sell-off occurred in relation with the more global spread of the virus and the large amount of uncertainty about the actual impact of the virus on our economies. All three indices across the globe were similarly affected during this period of panic, where the S&P 500 and EURONEXT 100 indices dropped by about 30% - 38%.
It can also be seen that the HANG SENG index reacted to China’s virus situation sooner than the other markets in late-January 2020. As the cases in China were contained, HANG SENG’s drop was relatively small, with a YTD low of 24% in March and a relatively flat continuation thereafter.
Furthermore, globalisation causes the global financial markets and indices to be highly interconnected. As a result, indices can move in conjunction with trends of indices seen in other countries. For instance, during the pandemic, economic and political measures were implemented by various countries. The shutdown of flight services between the US and most European countries on 12 March 2020 caused both the S&P 500 and EURONEXT 100 indices to drop sharply, as investors factored in the economic ramifications of such a decision on businesses.
After the initial panic in mid-March faded, the markets started to climb upwards again at a much faster pace than expected. For instance, in the US, the S&P 500 was driven to recovery primarily due to optimism with regards to the discovery of a vaccine and the support of the US Federal Reserve and the government. In Hong Kong, virus cases were kept relatively low during the first half of 2020, bringing a positive outlook for the future – though political unrest unrelated to COVID-19 may have also adversely impacted the HANG SENG. In comparison though, S&P 500 rebounded to a level higher than the HANG SENG and EURONEXT 100 indices.
The impact of COVID-19 was larger than previous financial crises
In past financial crises, bubbles in the market of corporate equities and bonds have been the major cause of economic downturns. For instance, the 1929 crisis resulted from the bursting of a large bubble in corporate equities, and the 2008 financial crisis was caused by failing assets in mortgage backed securities. In contrast, the economic crisis induced by COVID-19 is considered as an unprecedented event in modern history, wherein an external event is causing a worldwide financial crisis.
In a normal economic cycle, financial downturns are periodic and occur organically. However, in the case of COVID-19 supporting measures in the form of financial support from governments and central banks worldwide are highly necessary.
On 18 March 2020, the European Central Bank (ECB) set up a €750 billion Pandemic Emergency Purchase Programme (PEPP) and increased this on 4 June to €1.350 billion - among other financial measures. The PEPP aims to increase money circulation in the open economy by providing liquidity. PEPP is a quantitative easing (QE) measure, meaning that securities that are held by banks (such as corporate loans and mortgage bonds) are purchased by the ECB, allowing banks to have more access to money. QE thereby increases lending capacity and lowers borrowing costs for consumers.
Similarly, in the US, the Federal Reserve has taken steps to support the economy during COVID-19 by introducing a number of monetary measures, including QE, setting near-zero interest rates, repurchase agreements, direct bank lending, Commercial Paper Funding Facility (CPFF), and many more programmes. As seen in figure 2, the scale of asset purchases by the Federal Reserve for the COVID-19 response led to a total of $7 trillion, which is gargantuan in comparison to the financial crisis in 2008.
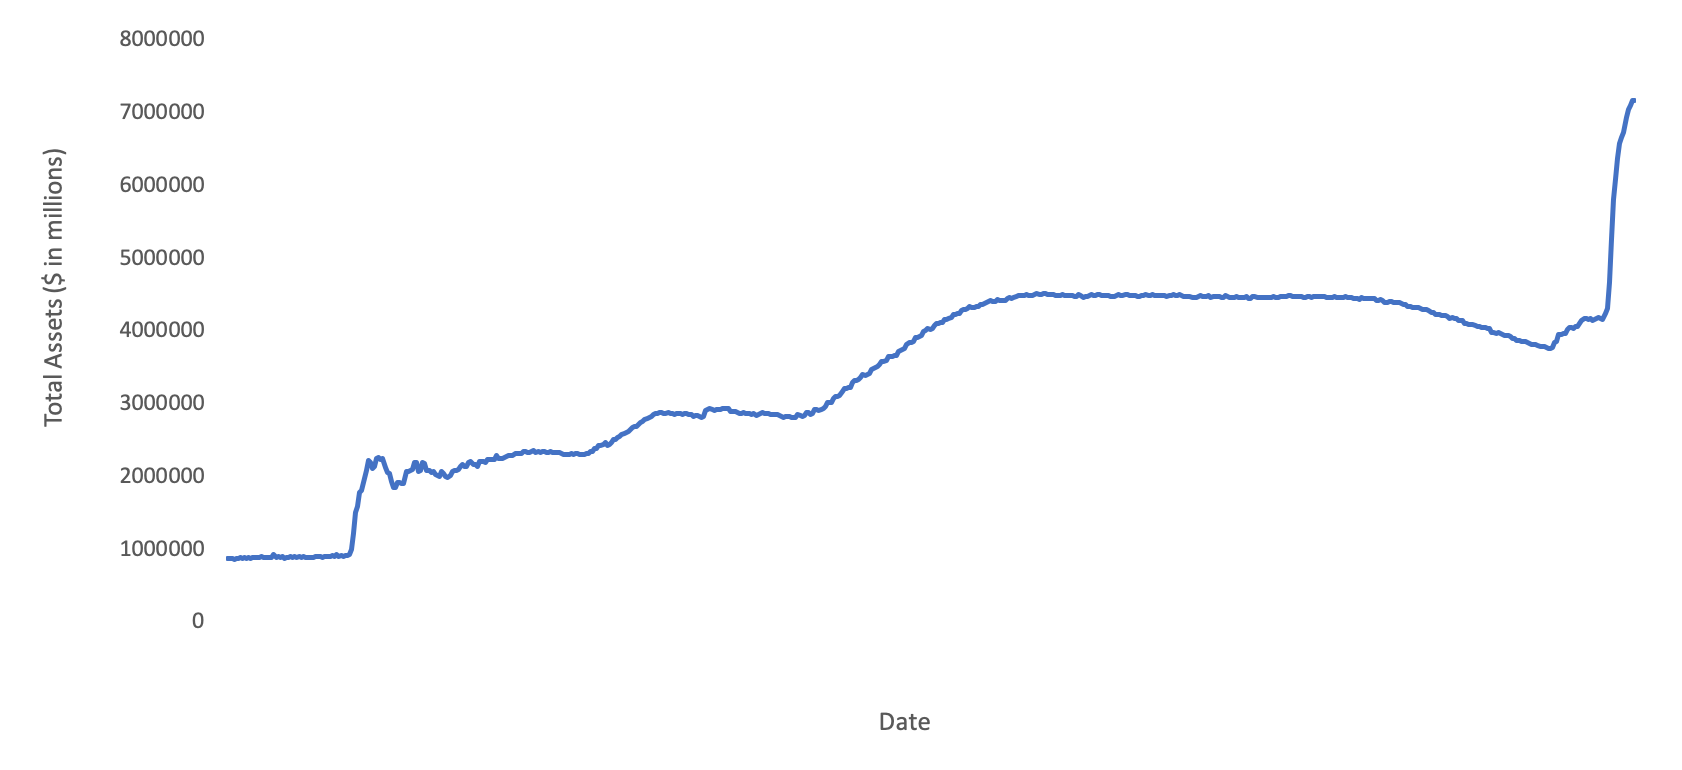
Figure 2: Total assets held by Federal Reserve Bank in USA showing a steep increase during
the COVID-19 pandemic response. Source: US Federal Reserve
How are investors managing their investments?
As markets fluctuate, both institutional investors and retail investors rebalance their portfolios. Rebalancing implies that investors sell their non-performing assets and purchase others that they perceive will gain value going forward.
Well-seasoned investors formulate their portfolio of assets carefully, either by direct research on the investment products or through the support of expert portfolio managers. However, even successful investors cannot always predict the behaviour of financial markets. Instead, they draw on a methodology of diversification to minimise the risks on their investments, while pursuing their desired return.
Typically, investment portfolios consist of a mix of assets, including equities, bonds, real estate, cash and alternative investments. For example, institutional investors such as pension funds require their assets to grow to ensure sufficient capital. Even when markets are volatile, investments need to be protected and returns need to be secured. The strategic asset allocation for Defined Benefit plans of pension funds in Europe is visualised in figure 3, which illustrates the compositions of portfolios of these funds per country.
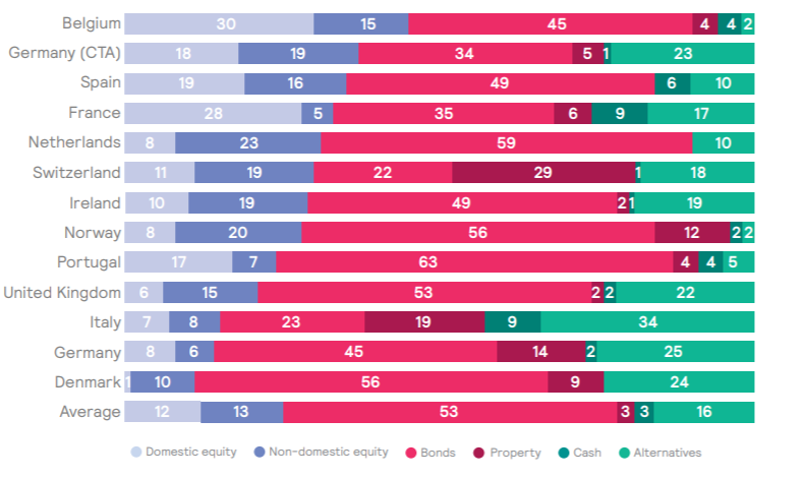
Figure 3: Strategic asset allocation by country for Defined Benefit plans of pension funds.
Source: European asset allocation survey by Mercer in 2019
As illustrated by the figure, pension funds in different countries vary their approaches towards their investing portfolio depending on their attitude to risk and the returns they seek. For instance, pension funds in Belgium have the largest share of equity assets, whereas funds in Denmark, Germany and Italy hold the smallest share of equity assets. These parities in asset allocation exist because of various reasons including government regulations, the national economic outlook, and fund size.
The rebalancing of portfolios typically drives further volatility in the market, which is characterised by rebounds in certain stocks – as was also visible in figure 1 during the months of May and June 2020.
Investors on financial markets show irrationality, which becomes even more evident during COVID-19
The volatility in the financial market gave new investors an opportunity to invest in assets or equities at lower costs. However, illogical trends were witnessed since the market hit the bottom in March 2020, which has upended many traditional retail and institutional investors.
For instance, the visual in figure 4 shows unemployment related to COVID-19 in the US, compared to previous years. As unemployment levels rose to enormous extents the figure had to be creatively fit onto the front page.
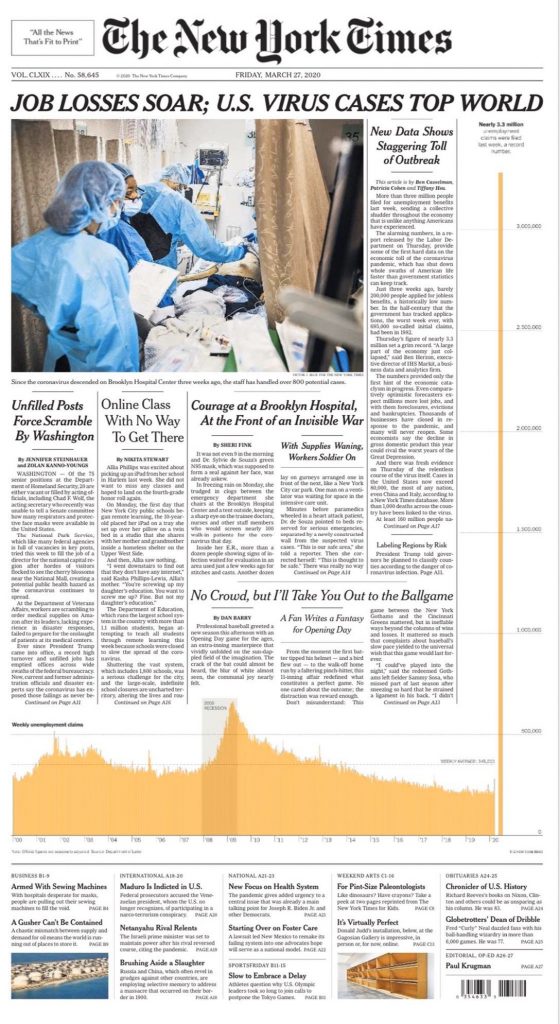
Figure 4: Graph illustrating spike in weekly unemployment claims due to COVID-19 on the cover of the New York Times.
With such high unemployment rates, one can expect that corporate earnings will be lower in the future and the prices of equities should trend lower. However, when these figures were published via weekly updates by the US Labour Department, the market was pushed higher instead, surprising many investors.
In another surprising case, the popular car rental company Hertz (HTZ) announced that it was filing for bankruptcy on 22 May 2020. Typically, when a company is bankrupt, its stock loses its value, as assets are sold to repay debt. However, after their announcement, the HTZ stock price rose astoundingly by about 900% in the following days ($0.56 per share on 26 May 2020 to $5.53 per share on 8 June 2020), as illustrated in figure 5.
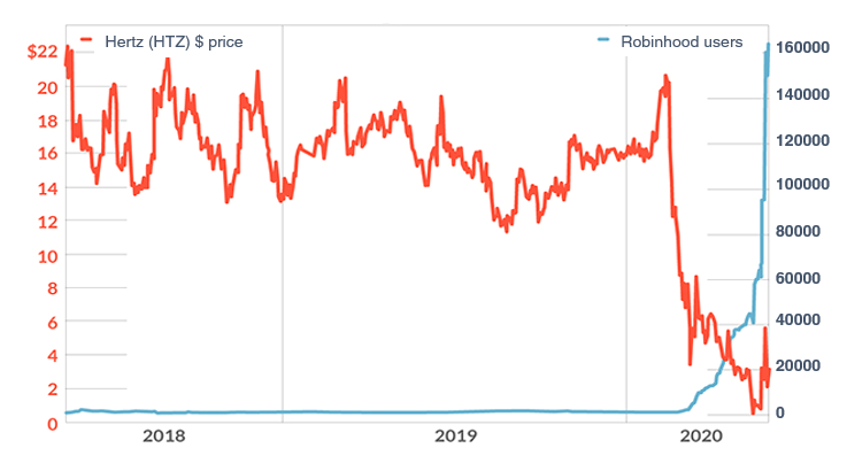
Figure 5: Comparison between the popularity of Hertz (HTZ) stock among Robinhood users (used by retail investors) after Hertz files for bankruptcy. Source: Marketwatch, Robintrack.
Figure 5 also illustrates the amount of Robinhood users that invested in HTZ over time. Robinhood is a popular retail brokerage firm amongst younger and new retail investors in the US, given its zero-commission brokerage. Correlations point out that investors using Robinhood have been piling up on Hertz stock, especially at the time where its bankruptcy was announced. New investors took riskier bets to seek high returns.
As the price of Hertz stock went up, the company decided to sell more shares to the public, raising about $500 million. The unexpected rise in share price would help the company raise money to cover its debt obligations, but it may leave investors to hold shares that have no intrinsic value. Following regulatory scrutiny by the authorities and widespread warnings in the media Hertz rescinded their stock sales plan.
Some companies benefit from COVID-19, whereas others lose out
COVID-19 has created a shift in terms of consumer behaviour, where the attention shifted from travelling and out-of-house activities to largely staying at home and even working from home. As a result, a number of technology companies increased their value, such as digital media and remote working solutions. On the other hand, companies that focus more on products for which individuals must leave their homes, such as companies in the tourism sector (e.g. airlines, hotels and cruises), hospitality and shops, lost out.
Below follows a visualisation of stock performance of technology companies Netflix, Spotify and Zoom (for online video calls), as well as two travel companies, Air France-KLM and Norwegian Cruise Line Holdings (figure 6).
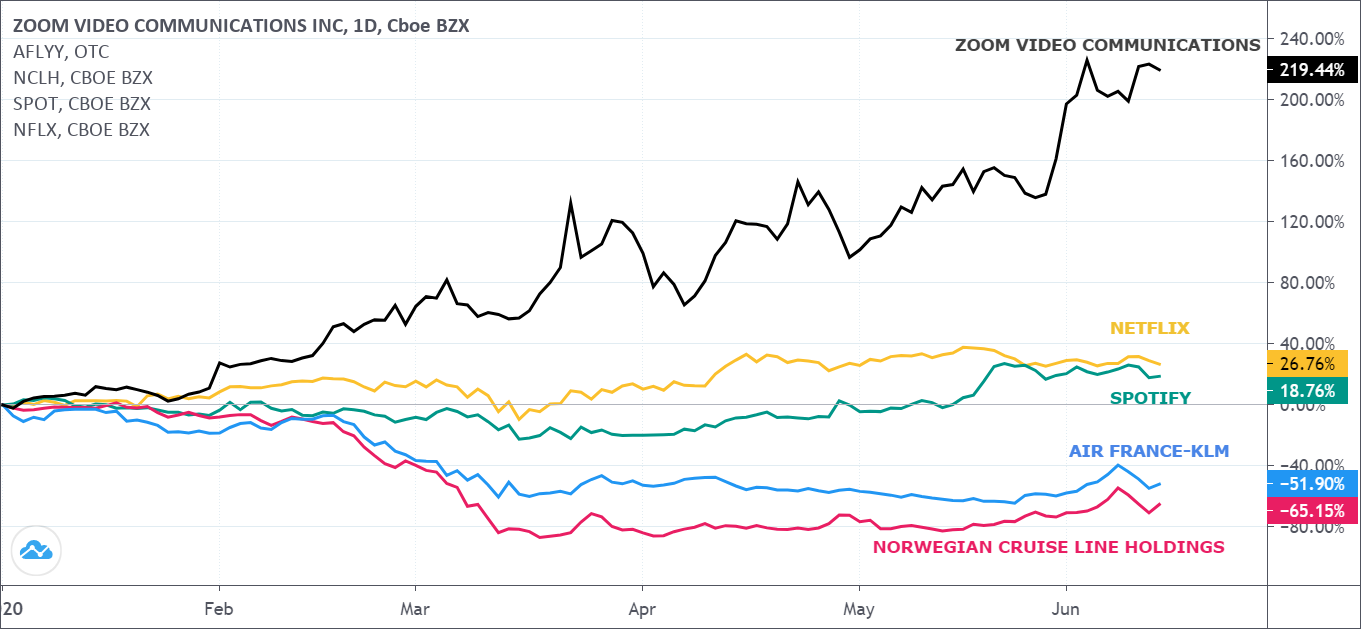
Figure 6: YTD comparison of stock performance among technology companies (Zoom communications, Netflix and Spotify) and travel companies (Air France - KLM and Norwegian Cruise Line).
From this visual it is striking to observe how the impact of COVID-19 could cause this great divide between the companies’ valuation. Zoom saw an increase of its stock price of 219,44% from January 2020 to 12 June. On the other hand, Norwegian Cruise Line Holdings’ stock decreased by 65,15% over the same time period, largely related to news releases which described unfortunate experiences of passengers on cruise ships. For instance, some passengers were quarantined on the ships, and some ships had difficulties with docking as no harbours accepted cruises hosting infected passengers.
Financial markets will remain volatile until COVID-19 is overcome
As a result of COVID-19, the financial markets have become volatile and harder to predict. Some assets have performed well, whereas others have deeply suffered. Support measures by governments and central banks are crucial to help people and companies get through the economic hardship caused by this health crisis.
Healthy and stable financial markets are typically driven by confidence amongst investors about the economy. The ECB, US Federal Reserve and other central banks worldwide pledge to help citizens, firms and governments to get access to the funds they may require for weathering the COVID-19 crisis. However, it is important to note that COVID-19 is a health crisis resulting in an economic crisis. Therefore, containing the virus or finding a vaccine are instrumental to reduce the volatility of the financial markets.
Recovery in the sectors that were negatively impacted strongly relies on preventing a second wave of the pandemic. Using data to understand the macro-economic and micro-economic trends is crucial while making investment decisions. However, in this case, financial markets will remain volatile until COVID-19 is overcome.
Contact form: https://www.europeandataportal.eu/en/feedback/form
Looking for more open COVID-19 related datasets or initiatives? Visit the EDP for COVID-19 curated lists and follow us on Twitter, Facebook or LinkedIn.
