Using open data to shape humanitarian action
10 years of the INFORM Index: Shared open data for managing crises and disasters
Humanitarian data encompasses a wide array of information collected to understand the needs of populations affected by humanitarian crises, the crisis context and the necessary response. It includes, for example, demographic details, health statistics, geospatial information, damage assessments and response metrics. This data plays a critical role in identifying needs, allocating resources, coordinating efforts, monitoring and evaluating interventions and advocating for affected populations.
In a world facing increasingly complex crises – ranging from conflicts and climate issues to economic instability – the reliance on humanitarian aid is growing. The European Union (EU) is one of the leading global donors of humanitarian aid, reflecting its commitment to solidarity with affected populations. Explore our previous data story for more insights on EU humanitarian aid. The EU’s assistance not only provides immediate relief but also contributes to stabilising regions, supporting development and addressing the root causes of conflict and migration.
Access to high-quality humanitarian open data is fundamental to the effective disbursement of EU aid. This data is crucial for assessing the impact of current crises and forecasting future developments. The European Commission, through its Joint Research Centre and the Directorate-General for European Civil Protection and Humanitarian Aid Operations (ECHO), exemplifies the integration of data-driven insights into humanitarian actions. A key tool in this effort is INFORM, a global, open-source risk-assessment platform that supports decision-making on humanitarian crises and disasters. INFORM includes data on 191 countries, drawing on contributions from a broad spectrum of organisations, including humanitarian, development and technical partners. This collaboration enables the evidence-based allocation of humanitarian aid and the development of integrated strategies for disaster risk and crisis management.
This data story will explore three key components of the INFORM database: the Severity Index, the Risk Index and the Climate Change Risk Index. The objective is to illustrate how open data can inform and enhance various aspects of humanitarian interventions.
The INFORM Severity Index
The INFORM Severity Index compiles information from various credible, publicly available sources, including governments, UN agencies and other multilateral organisations. Its primary objective is to measure and compare the severity of humanitarian crises and disasters globally on an ongoing and up-to-date basis. This open data initiative aims to systematically communicate the current status of crises in an objective and comprehensible manner to enhance decision-making processes. Since 2016, the Severity Index has helped develop a shared understanding of crisis severity, ensuring that all those affected receive the help they need.
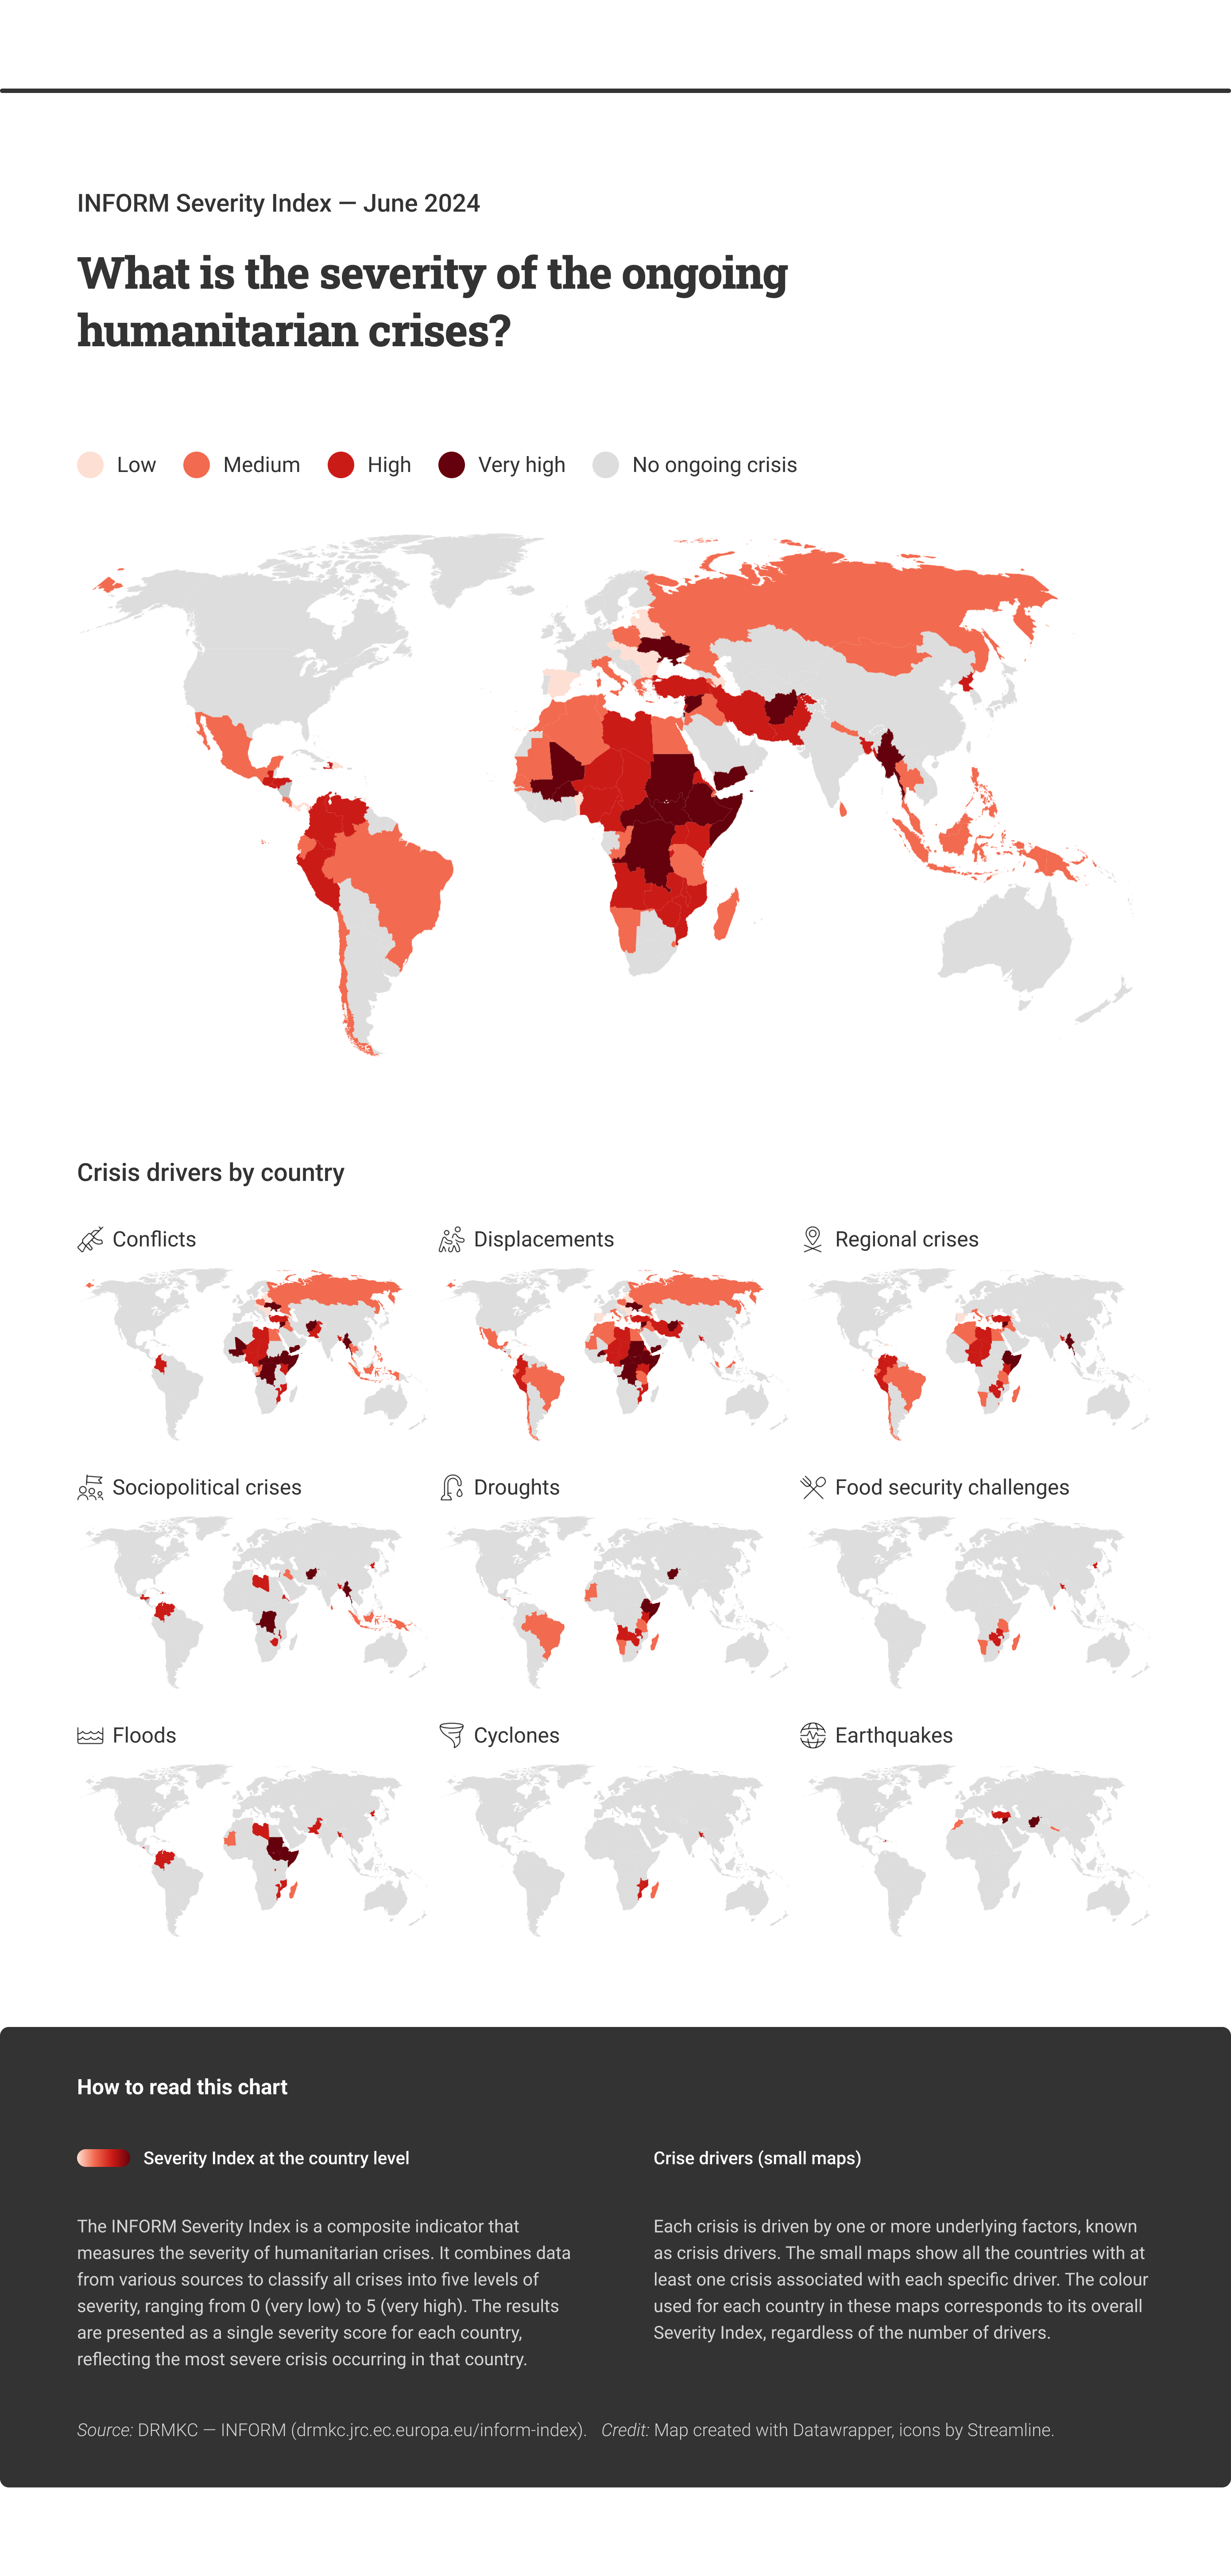
Figure 1 illustrates the ongoing humanitarian crises worldwide, driven by factors such as sociopolitical and geopolitical issues and natural disasters. Conflicts and displacements are the most widespread crises, especially across Africa, the Middle East and parts of Asia, where the severity of such crises is particularly high. Cyclones and earthquakes, while significant, tend to be more localised in their impact. Droughts, food security challenges and floods predominantly affect South America, Africa and Asia.
Displacement is a primary concern for the EU, particularly in southern European countries like Greece, Spain and Italy, which are impacted by mixed migration flows and regional crises along the Mediterranean routes. Eastern European countries are currently particularly affected by displacement resulting from Russia’s war of aggression against Ukraine, with Poland being the most impacted, followed by Czechia, Romania, Slovakia and Bulgaria. This concentration of severity highlights the significant humanitarian burden in these countries. For a more detailed analysis of the different global crisis drivers, you can explore the specific maps and data here.

Figure 1: Overview of the severity of current humanitarian crises worldwide according to the INFORM Severity Index (source: data.europa.eu, European Commission)
The INFORM Risk Index
The INFORM Risk Index identifies where and why crises might occur, helping to reduce risk, build resilience and improve preparedness for disasters. It uses 80 different indicators to measure natural and human hazards, people’s vulnerability and socioeconomic exposure and the resources available to help populations cope. By creating a risk profile for each country, the index provides data-based evidence on whether a crisis might require international assistance, thereby improving the coordination of responses and aid efforts.
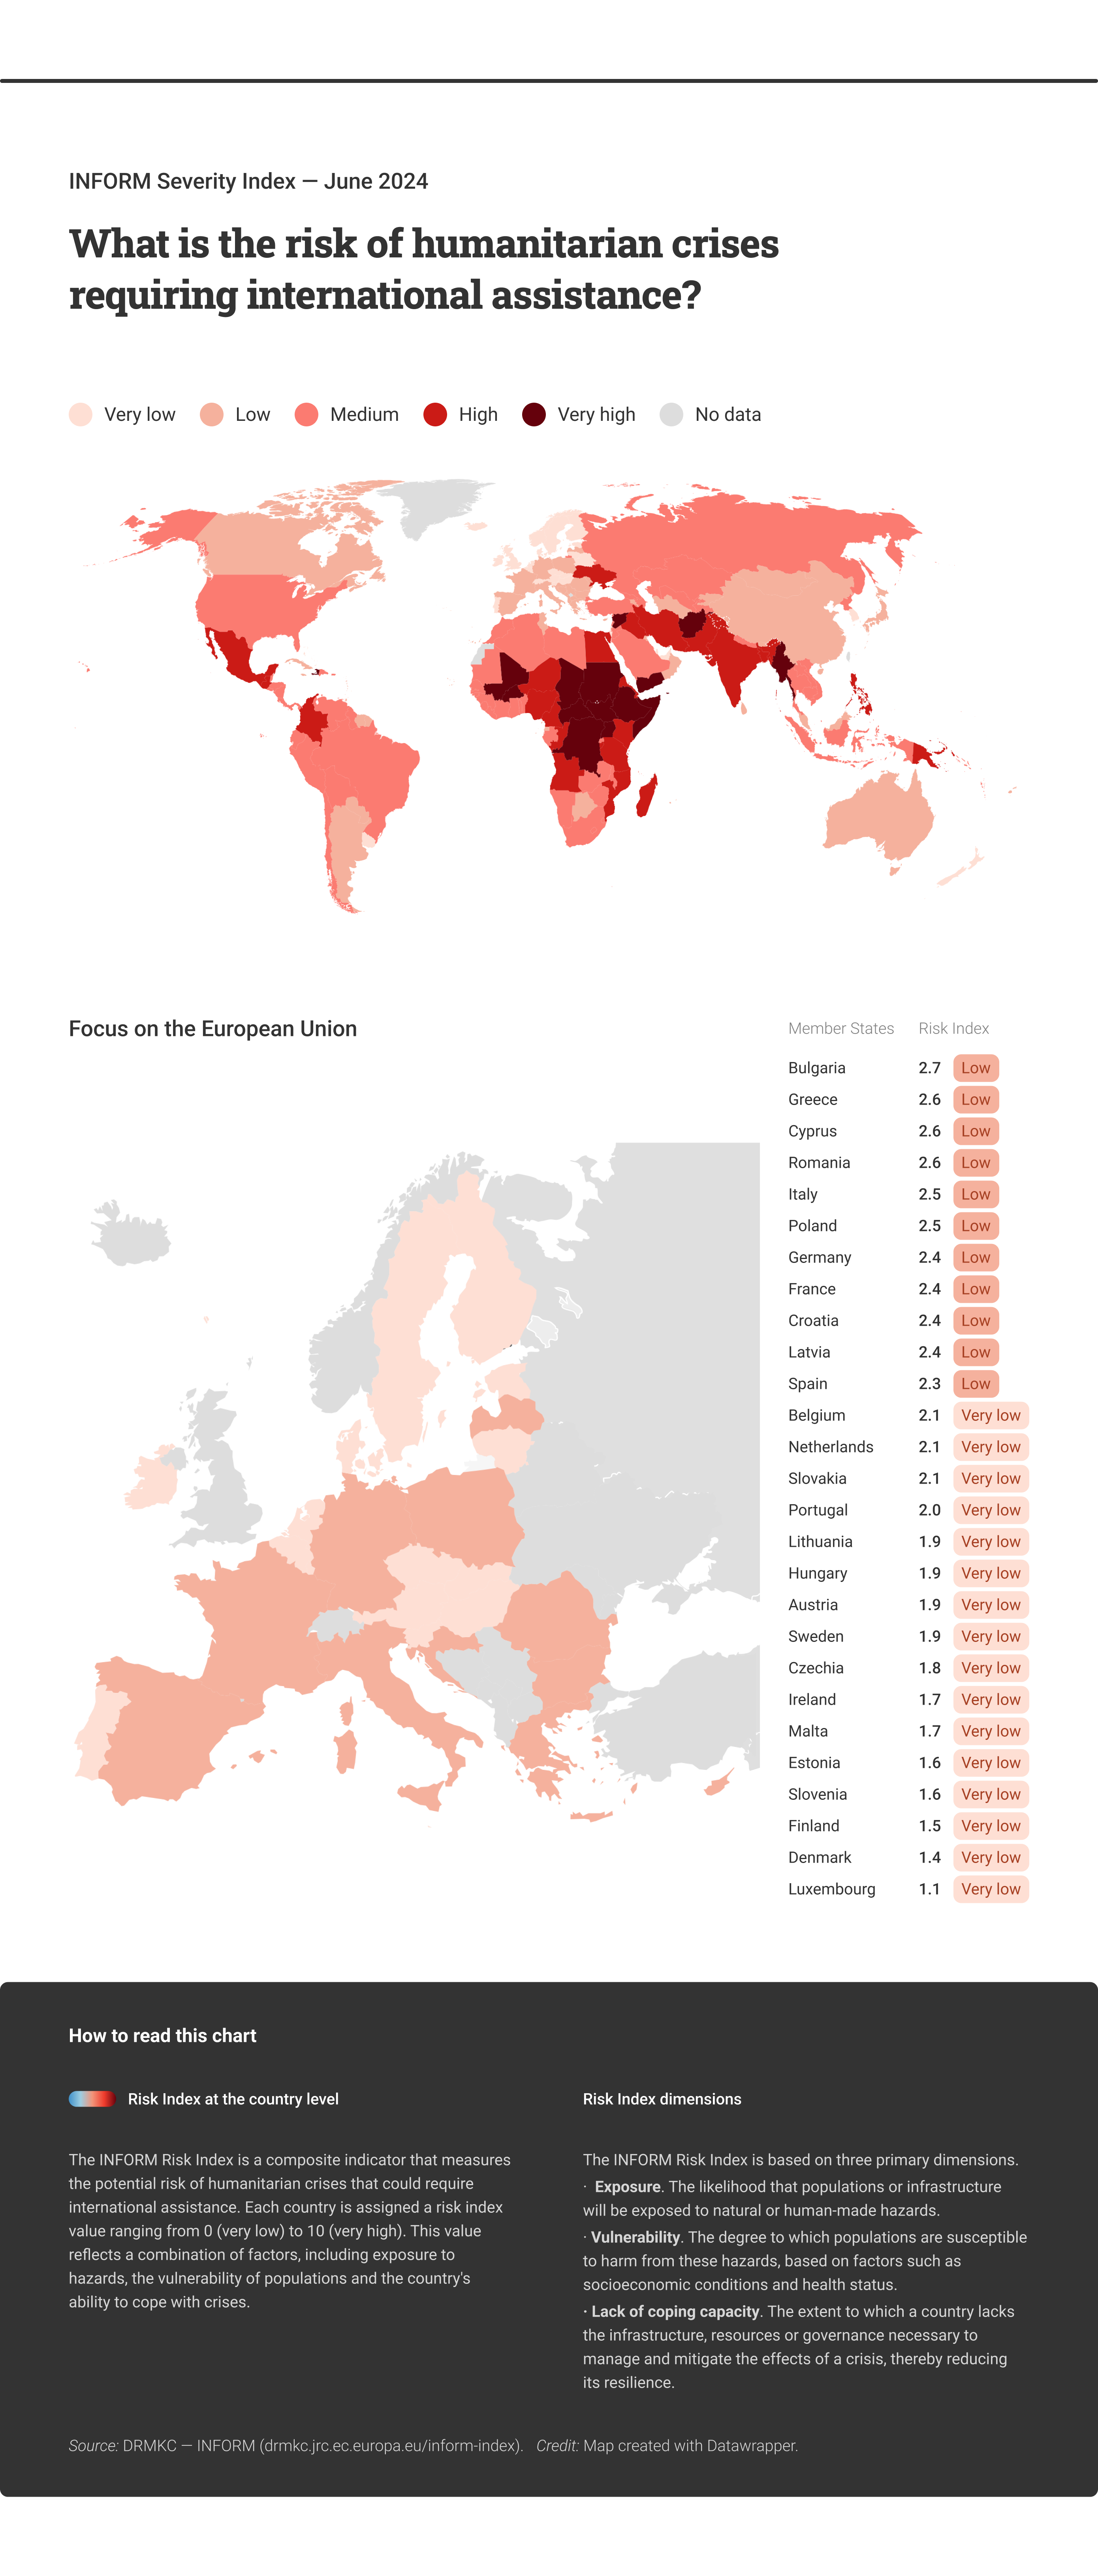
Figure 2 offers an overview of the probability of crises breaking out. The map highlights regions in Africa and the Middle East as having very high risks of crises requiring international intervention. Within the EU, the risk levels are generally low to very low, with Bulgaria, Cyprus, Greece and Romania showing the highest risk levels. In contrast, Luxembourg, Denmark and Finland rank lowest, indicating a minimal likelihood of requiring international assistance.
This variation within the EU and among countries in general is influenced by three main sets of factors:
- human or natural hazards and level of exposure (e.g. some countries may face higher risks due to their proximity to conflict zones and migration routes or may be more vulnerable to climate change risks due to their geographical position);
- the vulnerability of population groups;
- the country’s coping capacity, which includes factors such as financial resources and existing infrastructure for crisis management.
Exploring these underlying factors can provide valuable insights for targeted risk-reduction strategies.

Figure 2: Overview of the risk of crises requiring international assistance (source: data.europa.eu, European Commission)
The INFORM Climate Change Risk Index
The INFORM Climate Change Risk Index integrates climate and socioeconomic projections to assess how risks evolve under various emission and population scenarios. The analysis combines representative concentration pathways, which outline future atmospheric greenhouse gas concentrations, with shared socioeconomic pathways, which depict potential socioeconomic changes over the coming century. This approach evaluates projections at multiple points in time (2022, 2050 and 2080) to determine the change in risk and the ‘vulnerability gap’ – the additional coping capacity a country needs to maintain its current risk level. The goal is to support decision-making by highlighting the risks of climate-amplified hazards and identifying how improved vulnerability management can mitigate these risks.
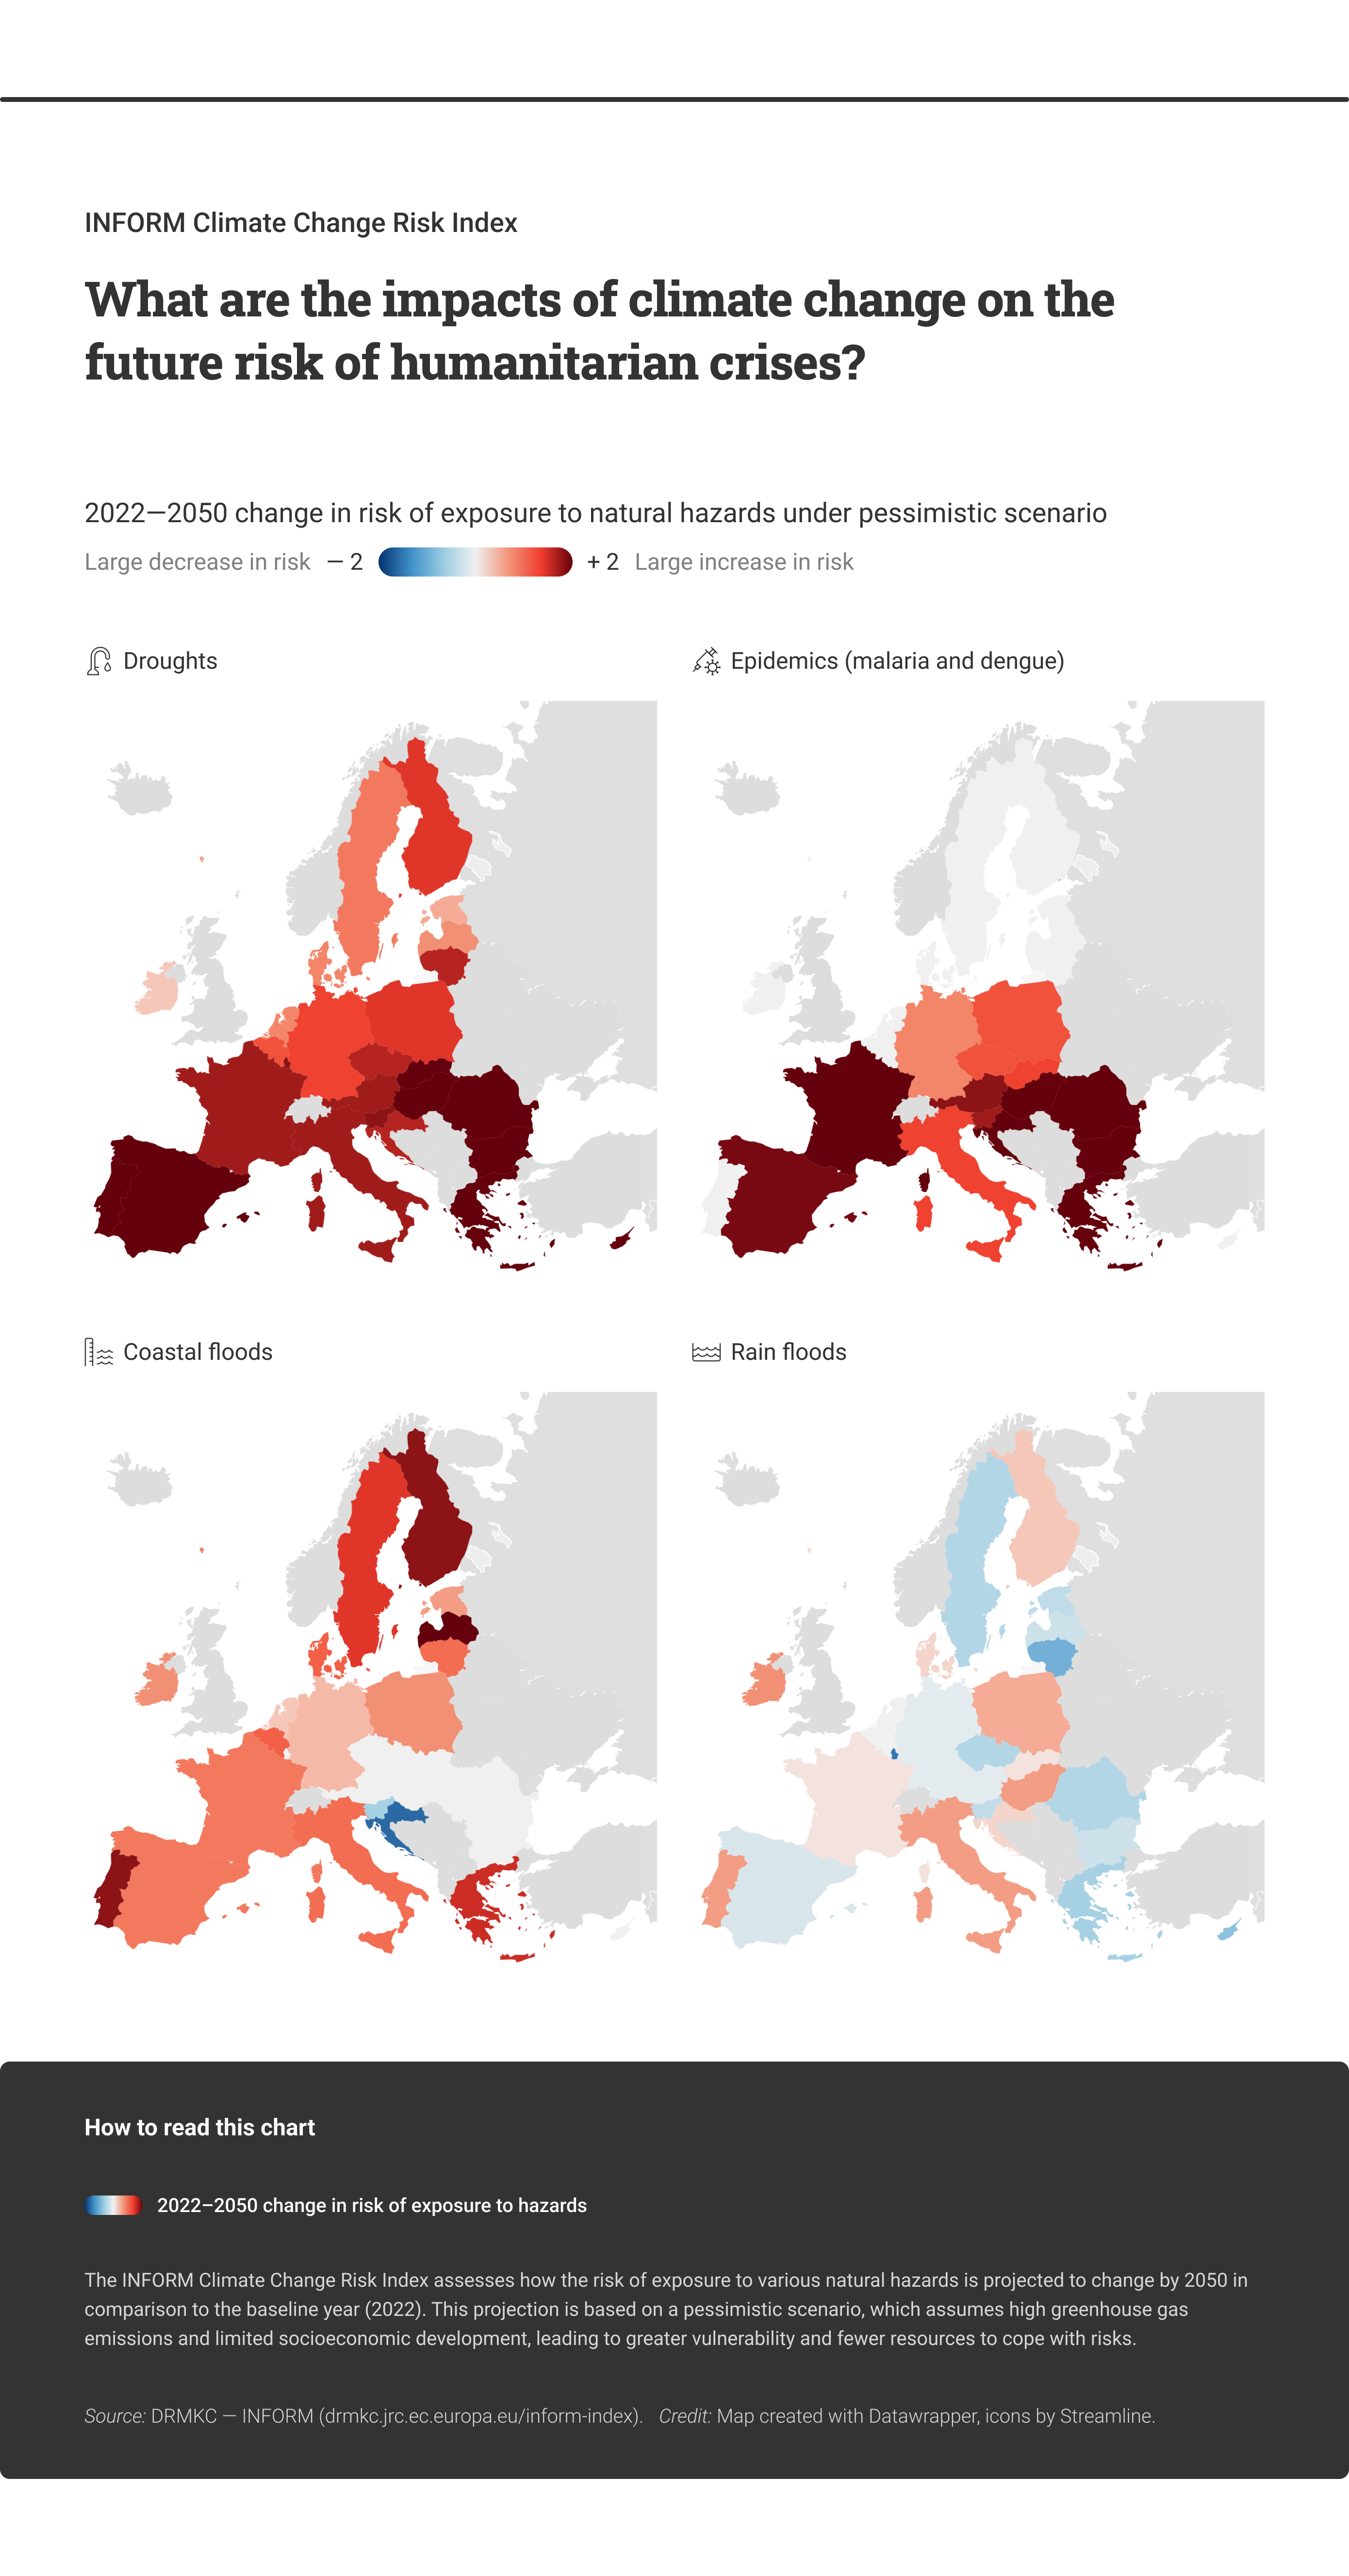
Figure 3 presents the change in risk of exposure to environmental hazards for the EU between 2022 and 2050 under a pessimistic scenario. This scenario envisions relatively low income growth, minimal investments in human capital, stagnation or decline in population in countries with a low birth rate, limited migration and slow urbanisation. Under these conditions, droughts emerge as a significant climate risk, impacting the entire EU, and particularly southern Europe. Epidemics, such as malaria and dengue, are also a growing concern, especially in central and southern EU countries, while Nordic countries are less likely to be affected. The coastal flooding risk varies across the EU, with some eastern European regions less impacted. Finally, flooding due to rain poses substantial risks in countries like Ireland, Italy, Hungary, Poland, Portugal and, to a lesser degree, Finland. These insights help identify where targeted efforts are needed to mitigate future risks.
For a deeper exploration of other climate scenarios, continue exploring here.

Figure 3: Overview of climate risks influencing humanitarian crises in the EU under a pessimistic scenario (2022–2050) (source: European Commission)
Conclusion
In a world where humanitarian crises are increasingly complex and interconnected, the ability to make informed decisions is more critical than ever. Open data plays a pivotal role in this process by shedding light on the severity of ongoing crises, the risks of future disasters and the potential impacts of climate change. Through tools like the INFORM Severity Index, Risk Index and Climate Change Risk Index, we can gain a comprehensive understanding of the challenges we face and more effectively respond to them.
By leveraging these insights, the EU and other global actors can target their humanitarian aid where it is needed most, anticipate future risks and develop strategies to mitigate the impacts of climate change. The power of open data lies not only in its ability to inform but also in its capacity to drive proactive and preventative measures.
Explore the INFORM Index further to discover how open data continues to shape humanitarian action. Stay connected with us for more data stories, webinars and updates by subscribing to our newsletter and following data.europa.eu on social media!
