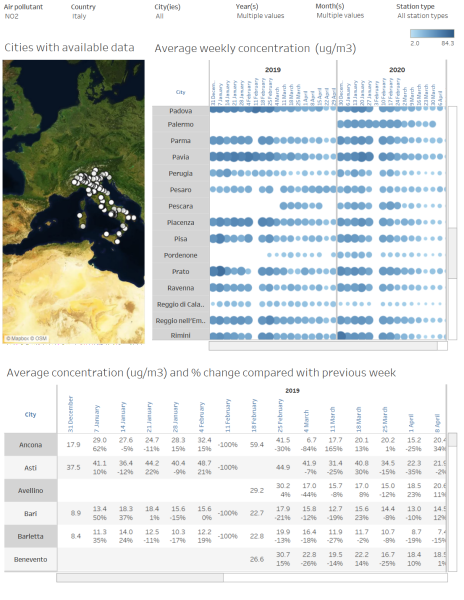
The European Environment Agency has developed a tool so you can see how lockdown has affected air pollution. The tool:
- tracks weekly average concentrations of nitrogen dioxide (NO2) and particulate matter (PM10 and PM2.5),
- provides hourly measures at some 3,000 monitoring stations across European countries.
You can also download air quality data, or use this map to view it.
Publication Date
Nature
Sito web
Charge
GRATUITO
Data Source
European Environment Agency
Subject
Air pollution, air quality, Covid-19
Functionality
Cartography
Data visualisation
Database
Information analysis
Maps
Statistics
Timeline
Link to application
Application from EU / Third party
EU
Language
English (en)
