Mapping the marketplace: Insights into EU trade
A deep dive into data shaping the trade landscape across the European Union
The European Union implemented a new trade policy in 2022, aiming to transform its economy. This policy represents a shift towards an economy that is robust and responsive, focusing on three main goals: supporting the EU’s economic recovery, aligning with green and digital initiatives, and reshaping global trade for fairness and sustainability.
Data is crucial for comprehending the complexities of trade within EU Member States. It provides a detailed, quantifiable representation of trade flows, revealing patterns, trends, and interdependencies between different economies within the EU.
The importance of trade data is also recognised by its inclusion in the high-value datasets, a list of datasets with a particular potential to generate socioeconomic benefits. The ‘statistics’ category of the high-value datasets includes a dataset called ‘EU international trade in goods statistics – exports and imports breakdowns simultaneously by partner, product and flow’, as described by Regulation (EU) 2019/2152.
This granularity is essential for analysing the volume, value and nature of goods and services exchanged, enabling policymakers, economists and businesses to discern the strengths and vulnerabilities of intra-EU trade networks. For instance, data can highlight which products or services are most traded, identify key trading partners within the bloc, and expose the impact of regulatory policies or economic events on trade volumes. It also helps in understanding the integration level of the single market and how changes in one Member State can ripple through the entire EU economy.
Using Eurostat data to analyse EU trade
Some of the most comprehensive data sources for analysing EU-wide trends are provided by Eurostat. The data shows which goods Member States import from and export to one another, and how that has changed over time.
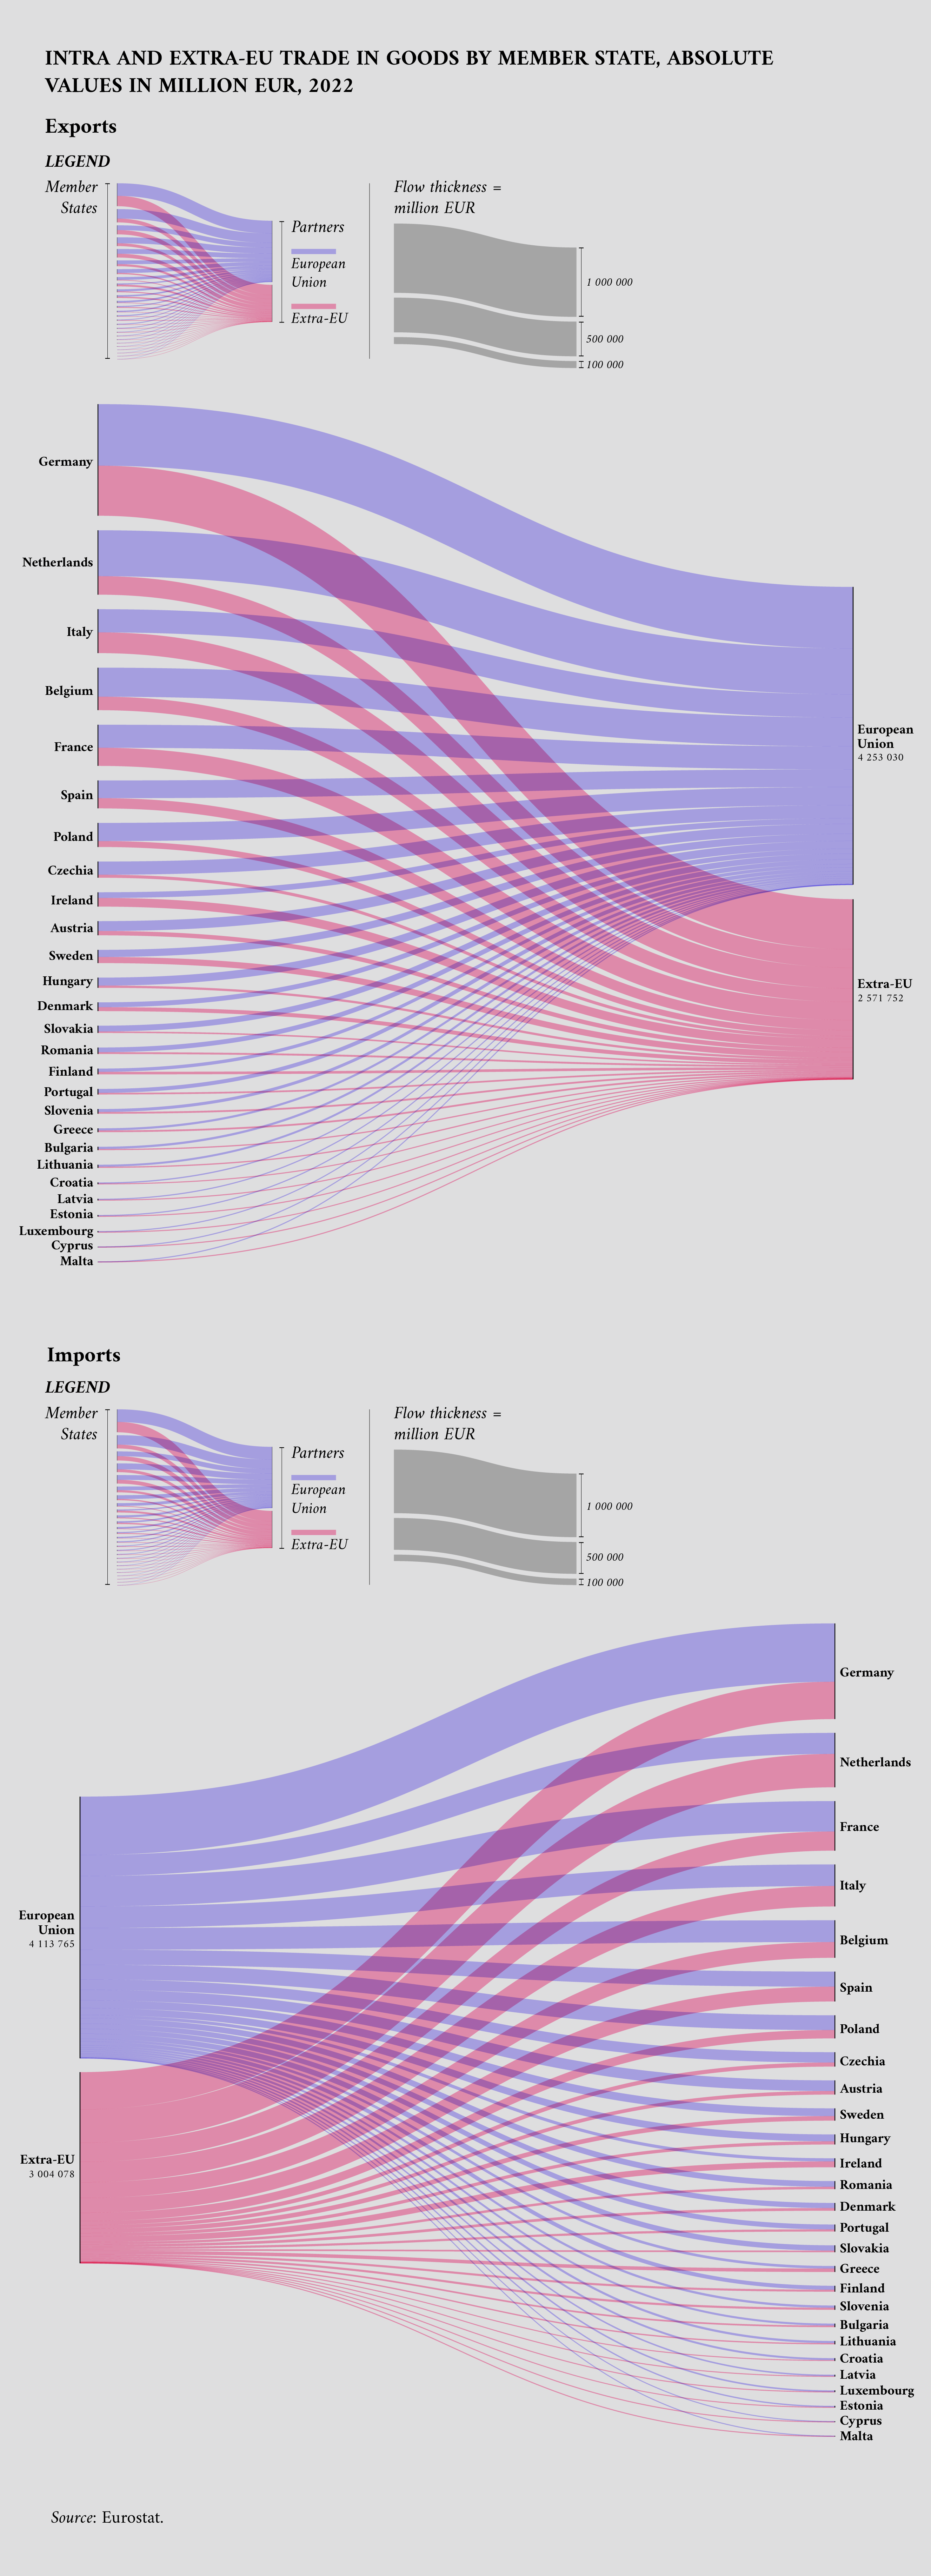
When it comes to exports, the data indicates that countries like Germany, Italy and the Netherlands are among the largest exporters in the EU. Germany’s export profile is substantial, with a notable balance between intra-EU and extra-EU trade. As for imports, Germany again stands out as a major player, with a significant volume of imports coming from both within and outside the EU. This reflects Germany’s robust industrial base, which requires a wide range of inputs from both EU and non-EU countries.
Italy, known for its variety of export goods ranging from industrial products to high-quality consumer goods, displays a balanced export approach between the EU and extra-EU markets. Italy’s import patterns also highlight a strong reliance on both Member States and non-EU countries, indicative of a diversified supply chain that supports its varied industrial and consumer markets.
The Netherlands, with its strategic geographic position and significant port infrastructure, shows a strong export presence serving as a key gateway for trade both within and outside the EU. Given its role as a major logistics and distribution hub, the Netherlands imports substantial quantities from both EU and extra-EU sources, further emphasising its role in European trade.
Analysing the EU trade data reveals distinct patterns of trade dependency. For instance, countries like Croatia and Cyprus are heavily reliant on the EU market for both imports and exports, indicating a strong orientation towards intra-EU trade. This is likely due to geographical proximity and tighter economic integration with other EU Member States. On the other end of the spectrum, a country such as Ireland shows a significant leaning towards extra-EU markets, reflecting its broader global trade focus and possibly historical trade connections beyond the European Union.
The following visualisation shows how much Member States traded – both for export and import – with other Member States, and with countries outside of the EU.
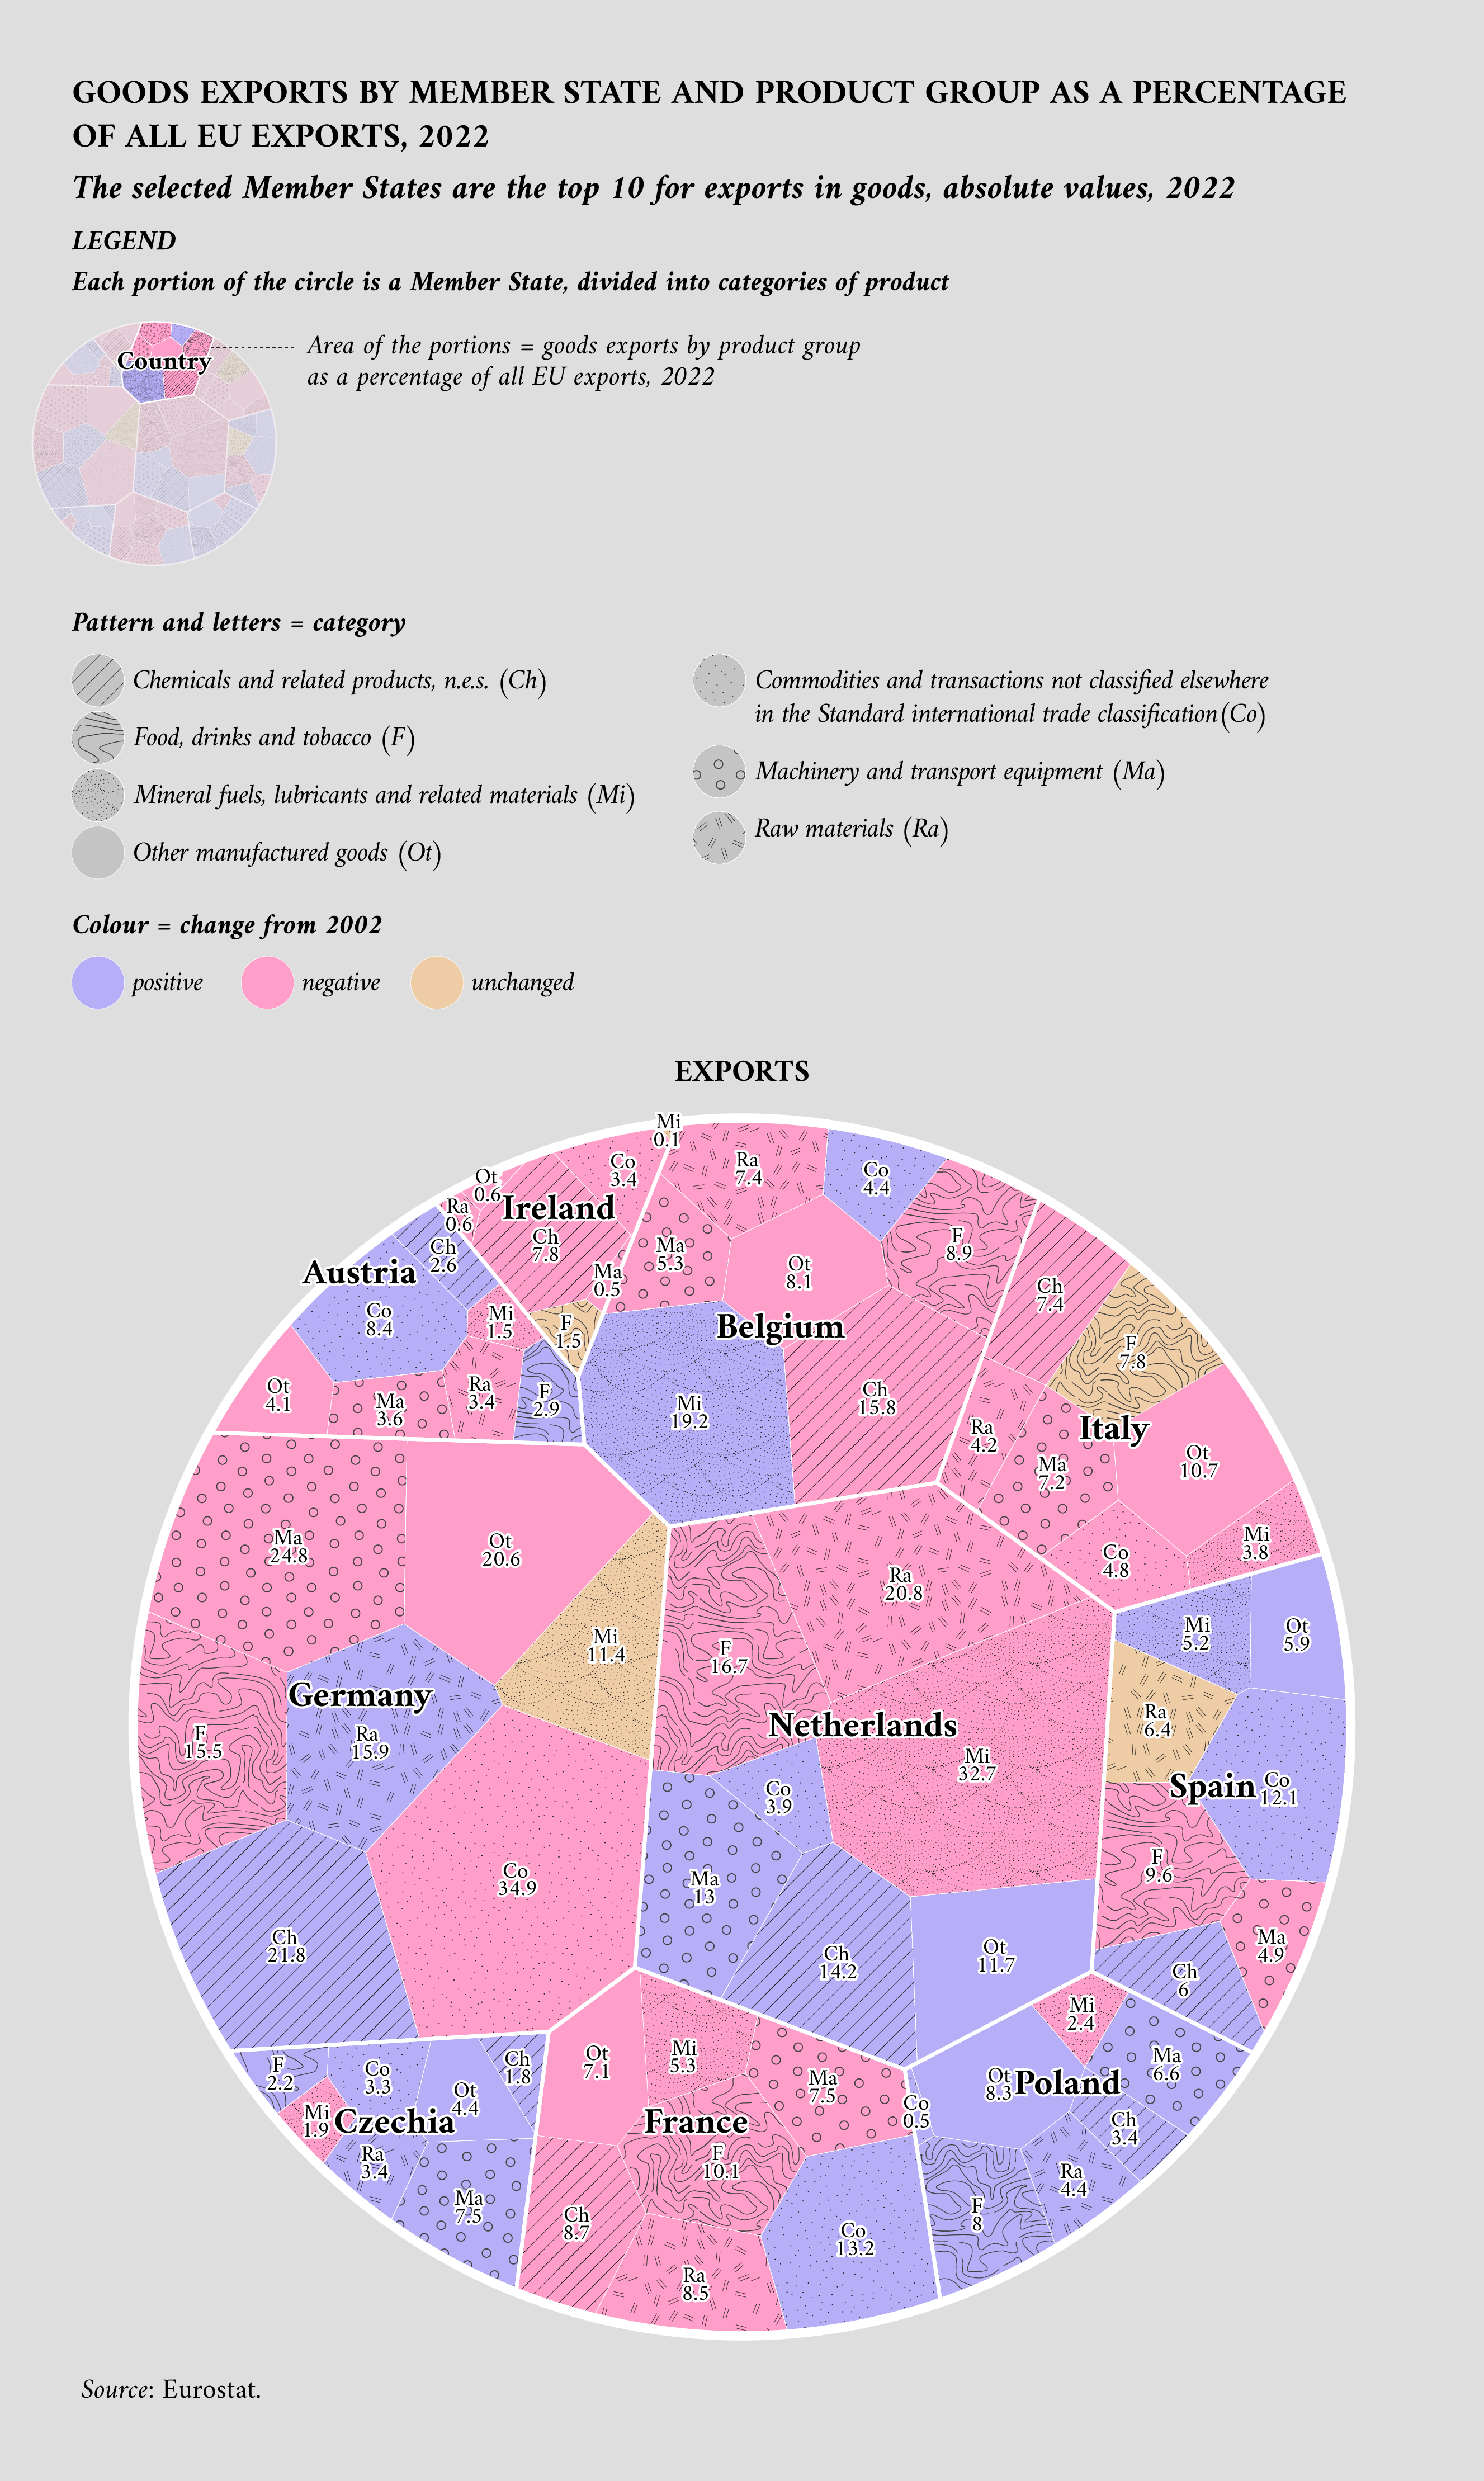
A more detailed analysis of data can also reveal the share of exports and imports for each country, and the types of goods that were traded in 2022. Expressed as a share of the total EU export, Germany leads the pack with a dominant presence in machinery and transport equipment, reflecting its global reputation in advanced manufacturing and automotive industries. The Netherlands follows, with a significant presence in mineral fuels, lubricants and related materials, showcasing its role in energy trade and logistics. France and Italy have a significant share of the food, drinks and tobacco total export.
The following visualisation highlights the exports of Member States as a share of all EU exports, and the types of goods traded.
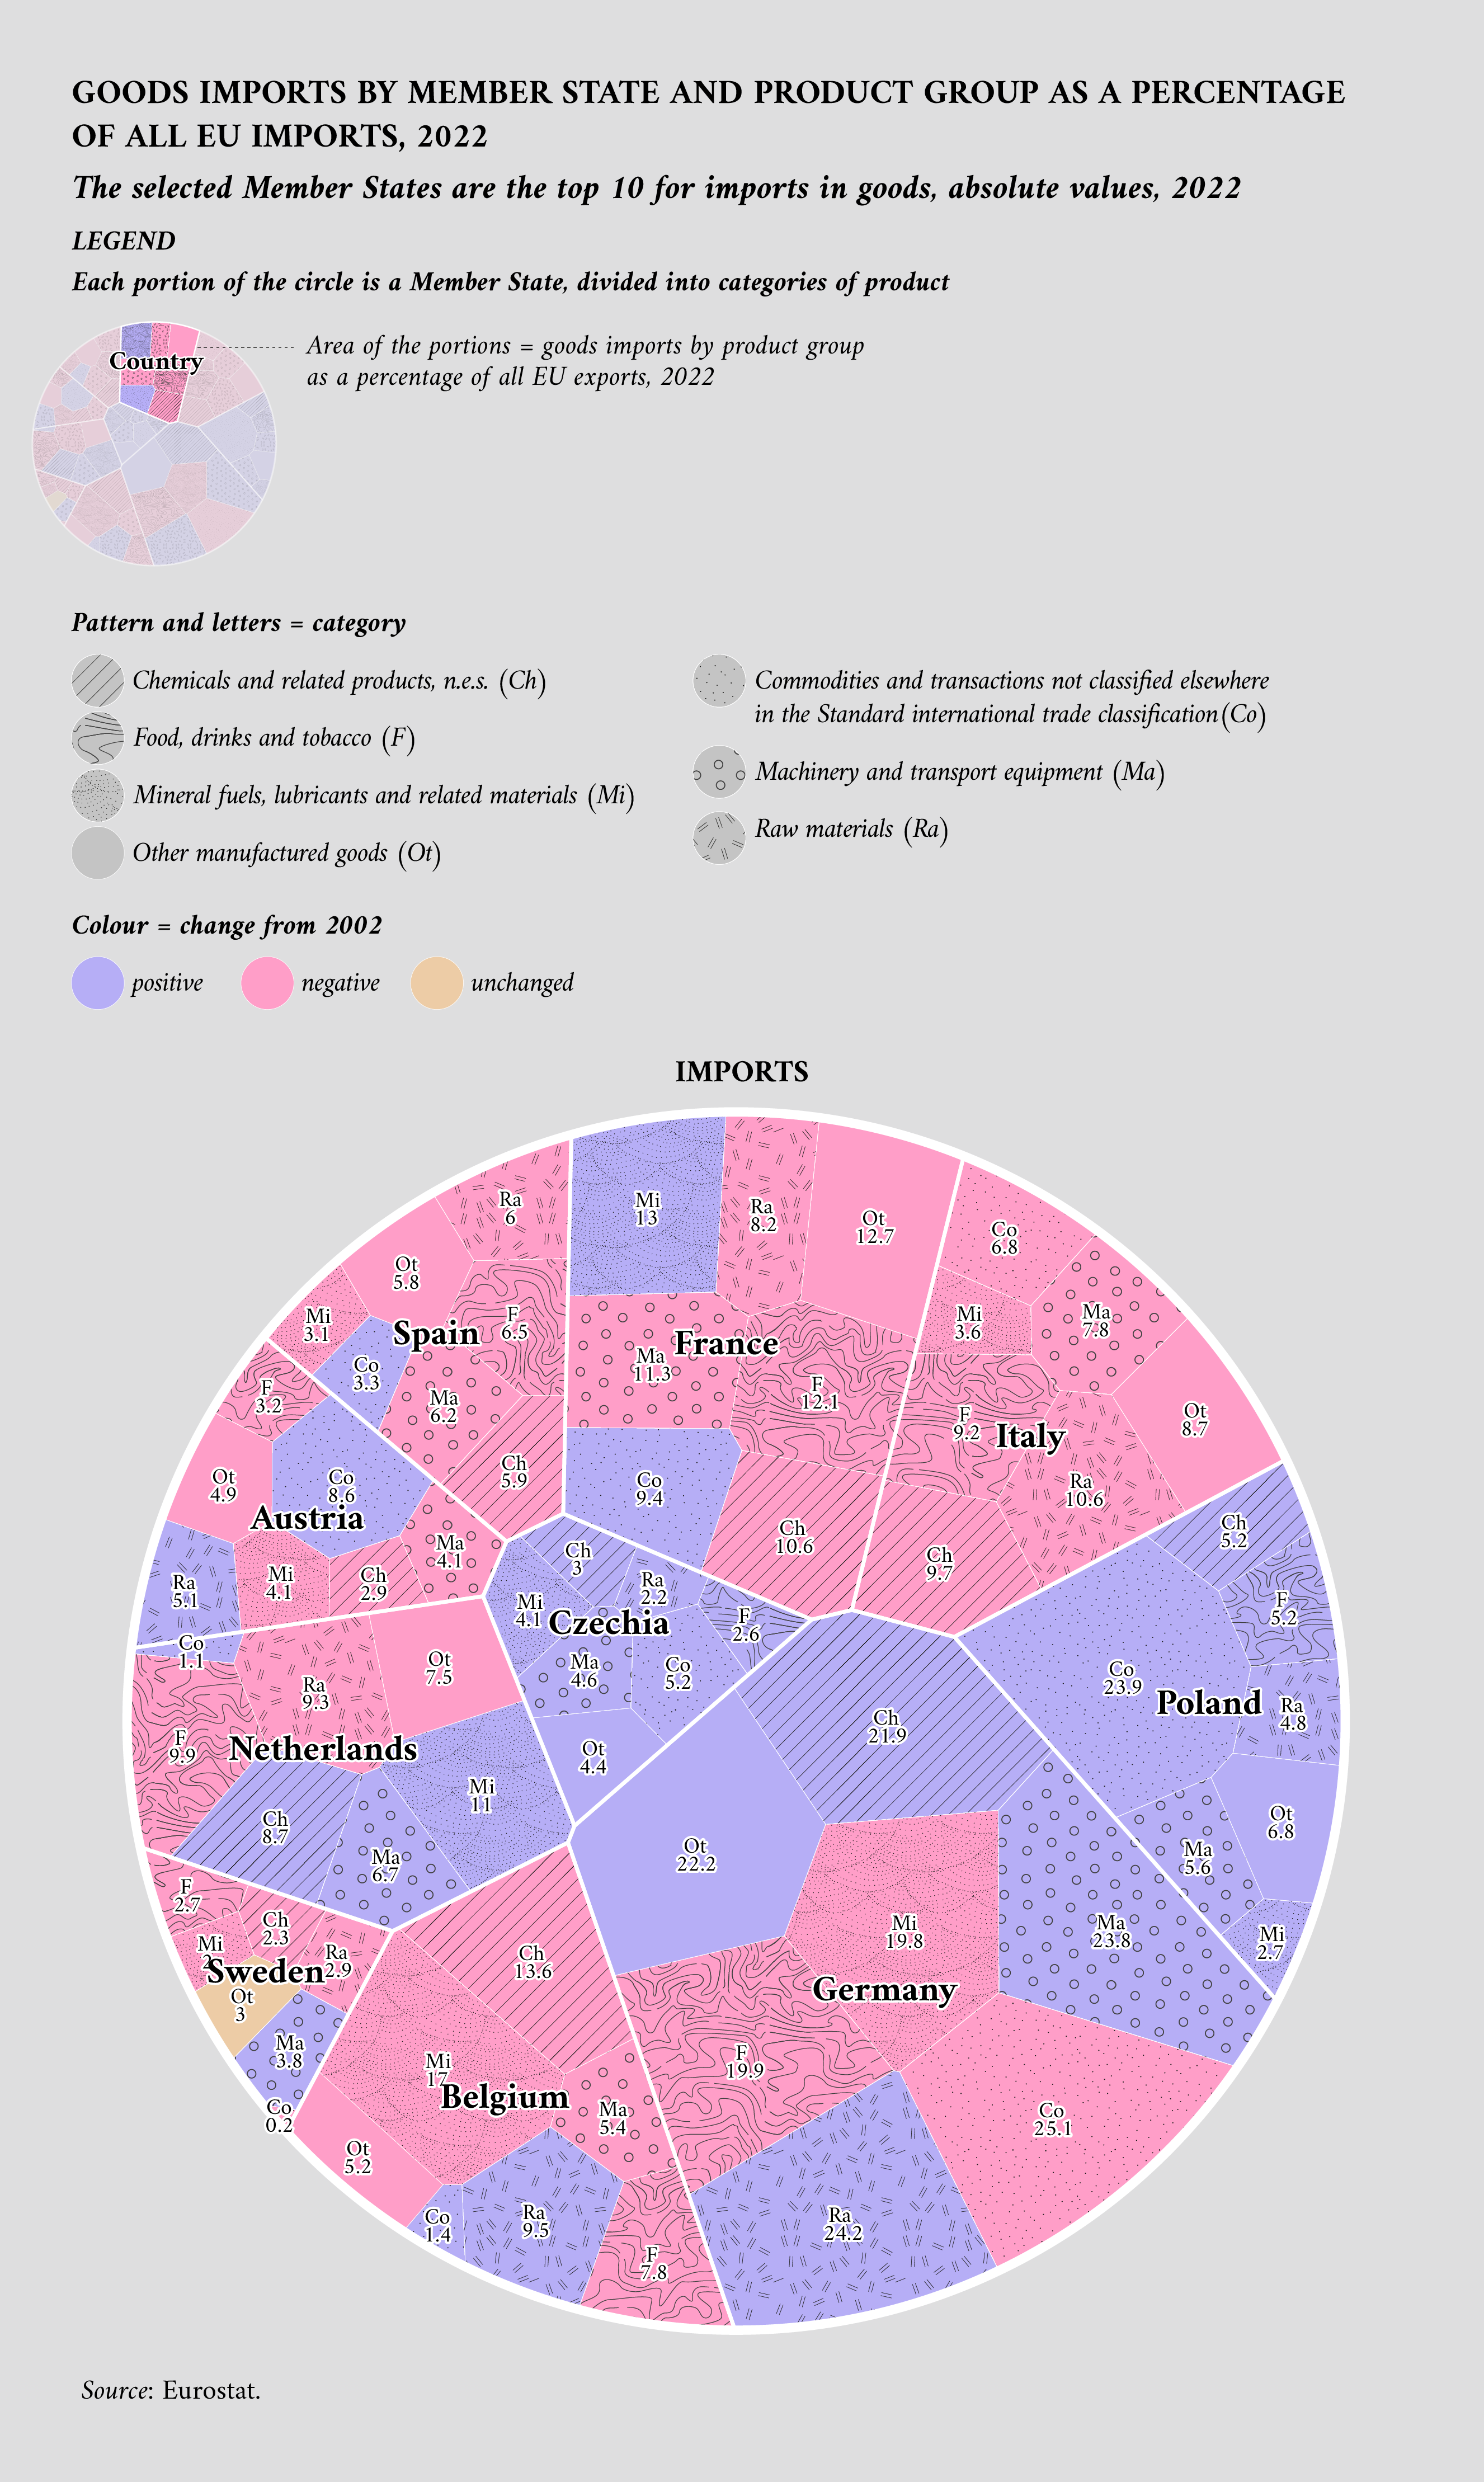
In the EU import landscape, Germany, the Netherlands, France, and Italy are key players. Germany leads with substantial imports, accounting for about a quarter of all machinery and raw materials, and a fifth of food, drinks and chemicals. The Netherlands, known for its logistical prowess, imports around 10 % of the EU’s total food, drinks and tobacco, along with similar shares in raw materials and mineral fuels. France and Italy also hold significant positions, with France importing a notable amount of mineral fuels, reflective of its diverse industrial needs. Italy, with its rich manufacturing heritage, particularly in fashion and the automotive industry, shows a strong demand for raw materials, chemicals and machinery, underlining the interdependence and varied needs of these major EU economies.
This visualisation displays the import proportions of Member States within the total EU imports, along with the categories of goods traded.
Using data.europa.eu for research about trade
Data.europa.eu offers a comprehensive repository of datasets that are useful for research on various aspects of trade by Member States. The portal aggregates a wealth of information, from broad economic indicators to granular trade statistics, with data ranging from trade volumes to market dynamics, and economic impact assessments, among other facets.
Other than just goods, data can also be used to analyse the trade of services. One dataset that stands out for its detailed insights into trade activities is from the Irish Central Statistics Office, highlighting the value of service imports and exports from 2016 to 2020. This dataset provides a breakdown offering a sector-specific view of the services trade. Moreover, it delineates the data by enterprise size, thereby allowing for a nuanced analysis of how different-sized businesses contribute to and are affected by trade flows. Such a detailed dataset is instrumental for understanding the nuances of Ireland’s services sector, its competitive landscape and the economic interplay between various industry segments.
As the following visualisation highlights, the largest imports are in the information and communication sector, as well as in manufacturing. On the other hand, the export of services looks more balanced, again with a significant presence of information and communication exports and all other sectors with a somewhat similar value.
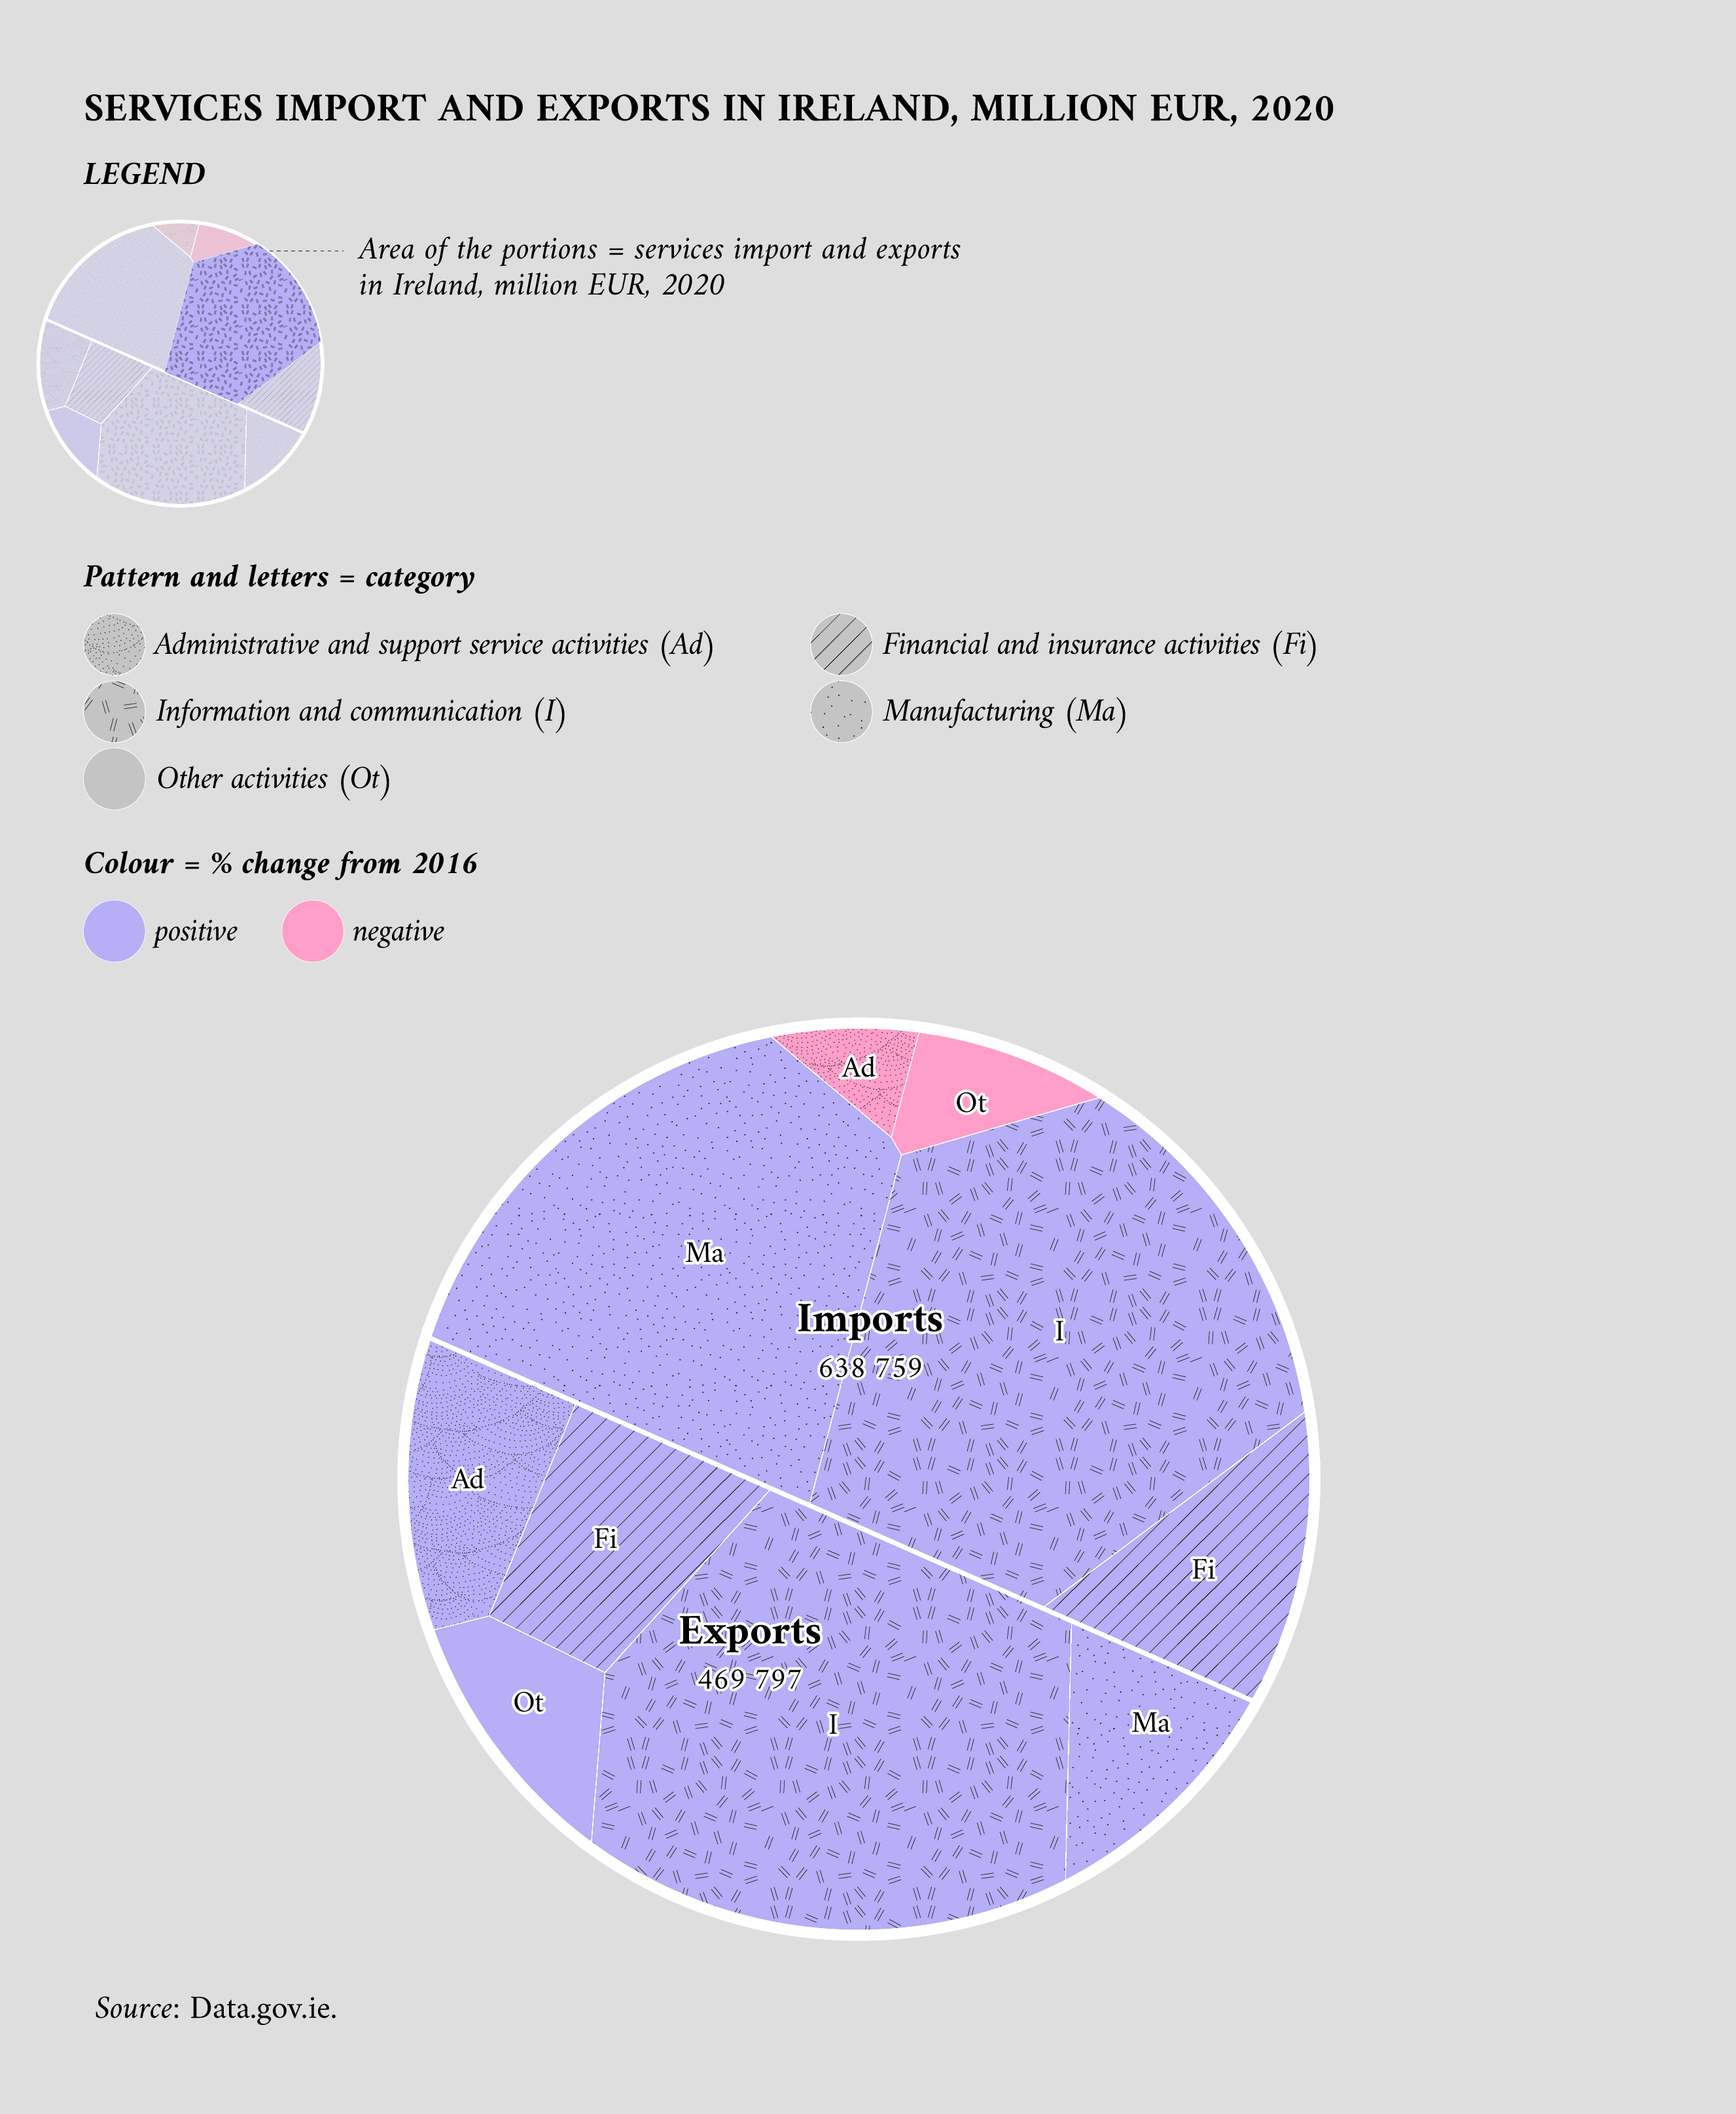
While the previous visualisation offers valuable insights into the trade of services in Ireland, it represents just a segment of the comprehensive data available. There are other facets of this dataset that warrant exploration, such as the size of the enterprise involved in the exchange.
Another important dataset on data.europa.eu concerns EU citizens’ opinions about trade. Datasets derived from the Eurobarometer surveys on various topics are made available on data.europa.eu, offering a repository of information for scholarly and policy analysis.
The information presented in this section is primarily sourced from Special Eurobarometer 357: International trade, a survey conducted by interviewing a representative sample of EU citizens to ensure that the sample accurately reflects the demographic composition of the EU population, thus providing reliable insights.
This Eurobarometer survey aims to assess the direct and indirect impacts of international trade on EU consumers. This encompasses examining changes in consumption patterns, employment shifts and overall economic welfare. Furthermore, it evaluates the perceived role and effectiveness of the EU within the ambit of global trade, providing an evidence-based measure of public trust and approval.
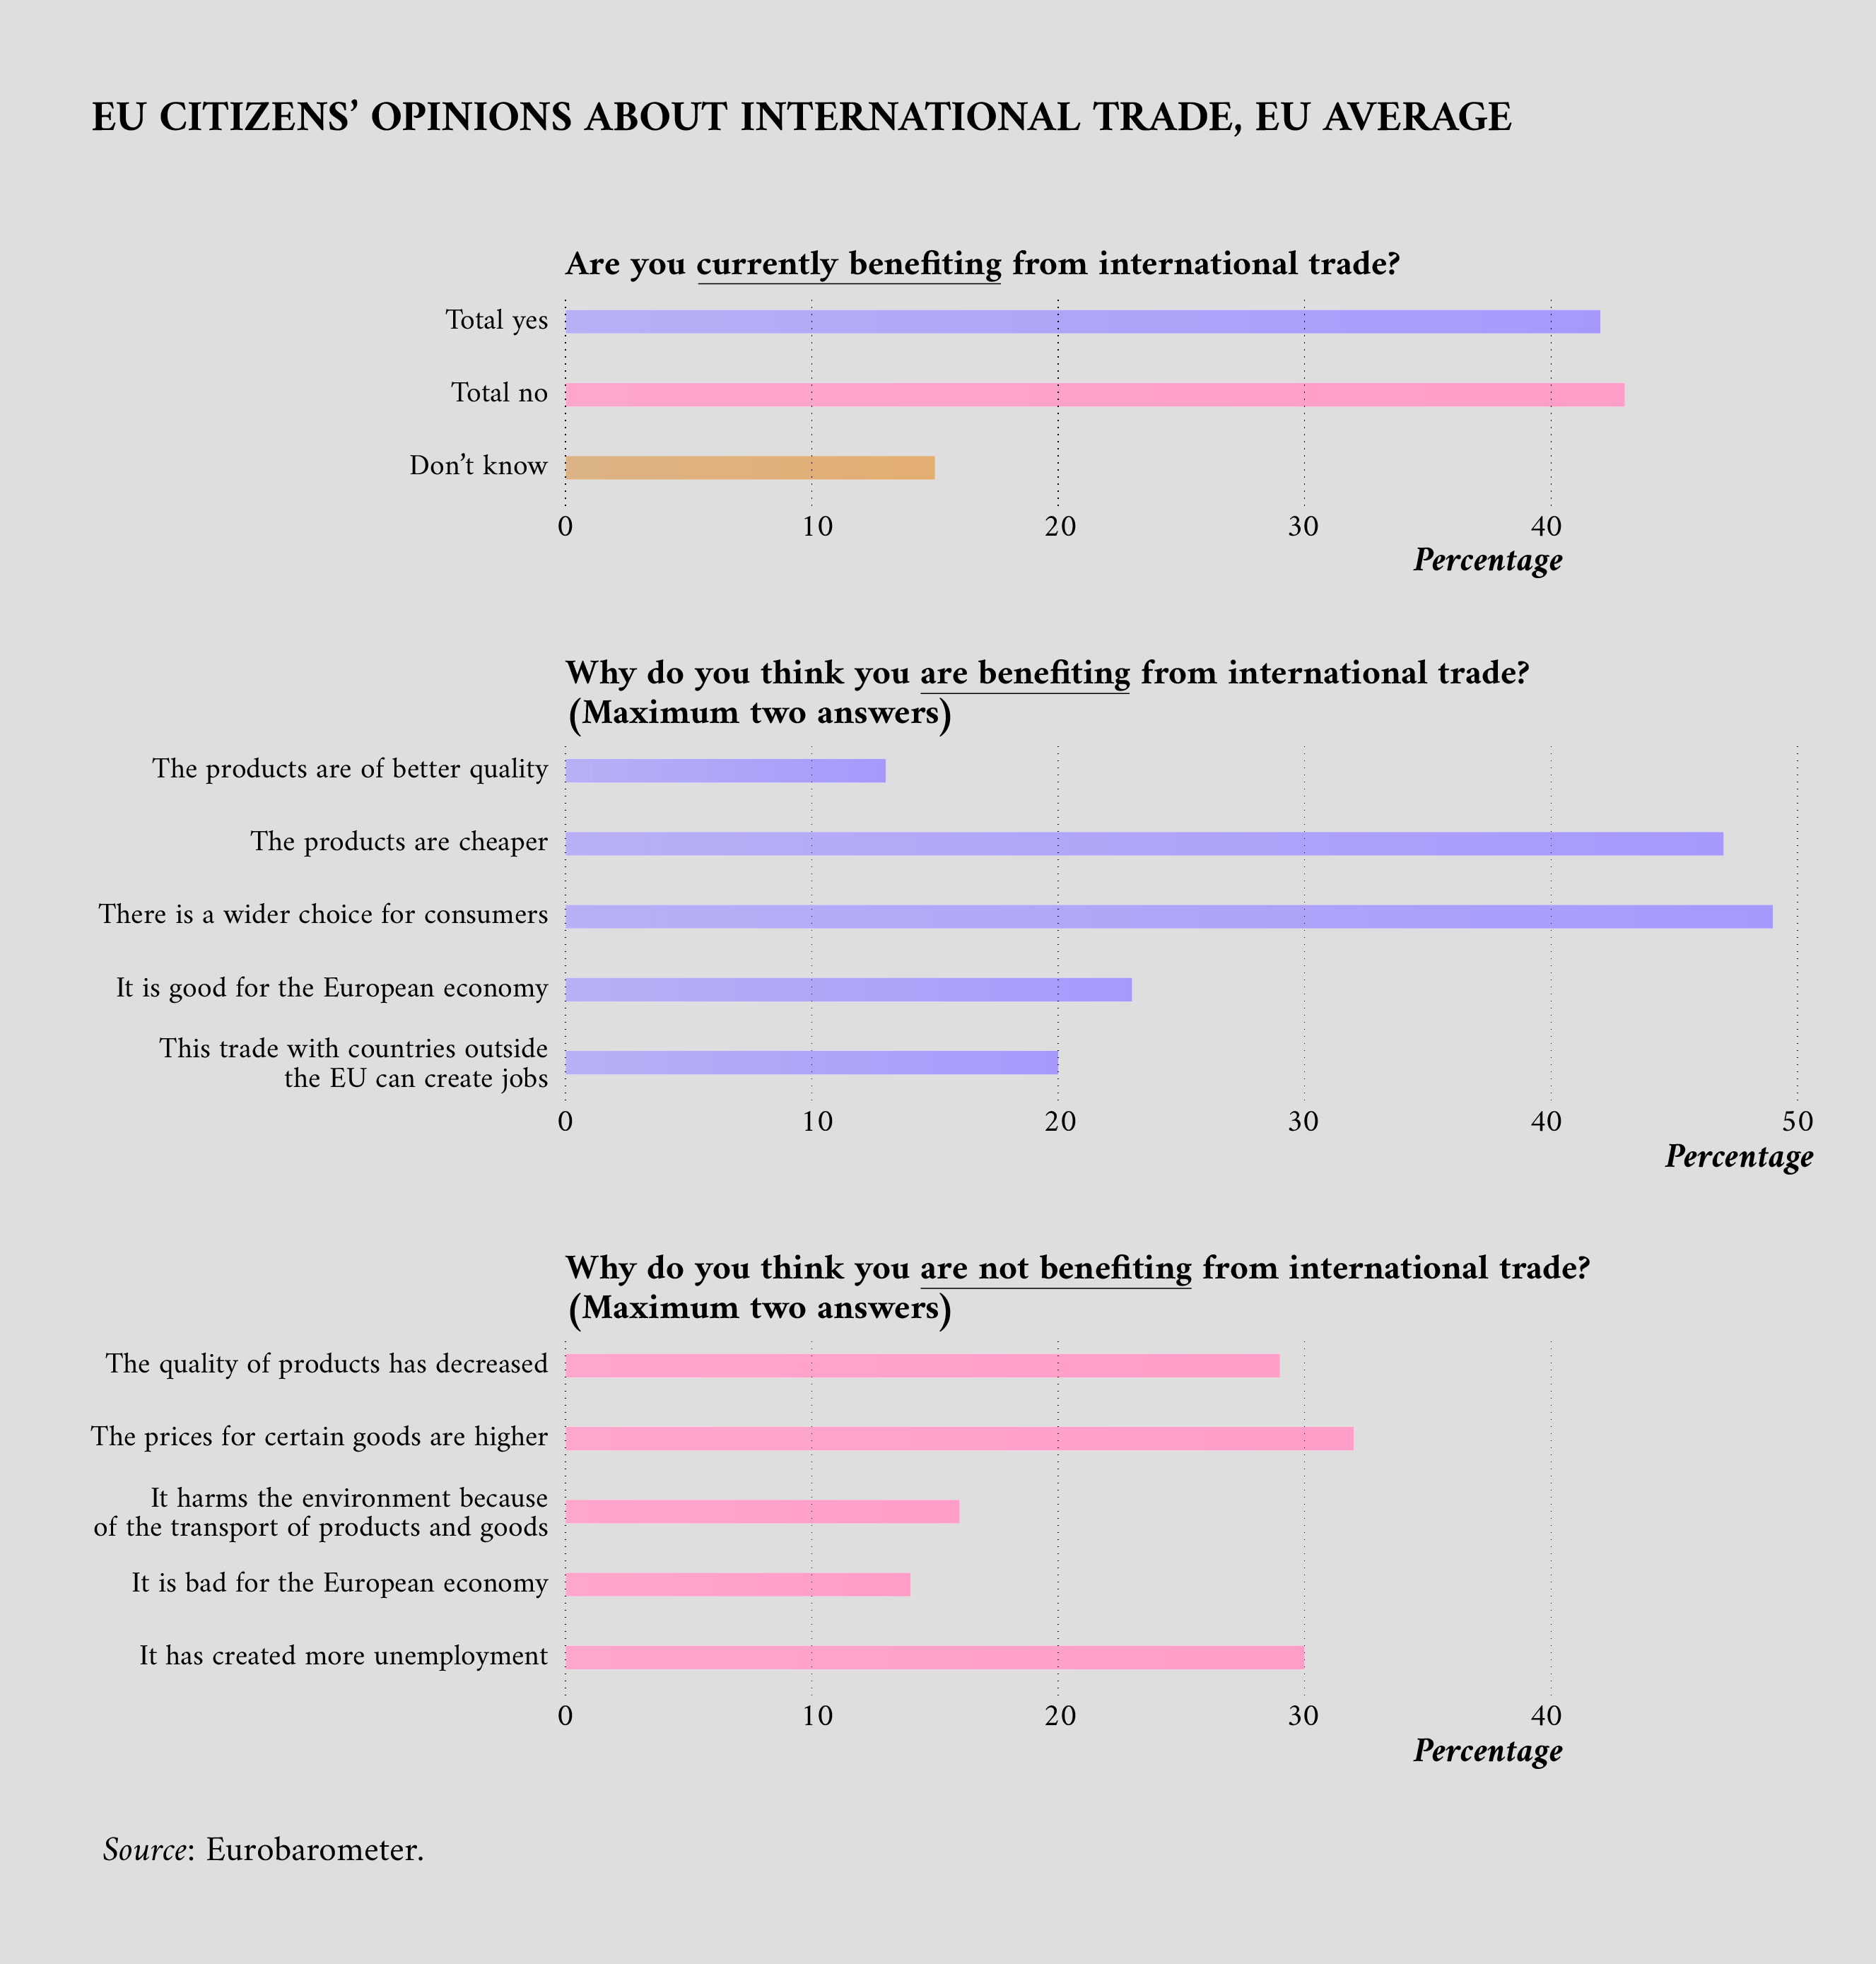
As shown in the next visualisation, the opinions of EU citizens about trade are about evenly split. An equal number of citizens say they are and are not currently benefiting from international trade. Among the respondents with favourable views, the most cited reasons are the availability of cheaper products and a wider choice for consumers. The other group of respondents remarks that there is room for improvement in terms of the quality of products, the prices for certain goods and employment.
Exploring additional data sources
Several other websites provide comprehensive resources for information related to trade.
- Using search keywords like ‘trade’, ‘imports’ or ‘exports’, the data.europa.eu portal offers a very high number of relevant datasets.
The Access2Markets portal provides essential data for conducting trade with non-EU nations, covering aspects like tariffs, taxation, processes, regulations, rules of origin, export guidelines, trade statistics, barriers to trade and numerous other relevant details.
Methodological notes
In visualisations 2 and 3 of this story, only the top ten exporters and importers were considered.
Article by Davide Mancino
Data visualisations by Federica Fragapane
