Open Data Maturity Report 2022: Countries’ perspectives on open data quality
Sharing experiences on open data quality across countries
In December 2022, the eight annual Open Data Maturity (ODM) report was published with 35 participating countries across Europe (EU27 Member States, EFTA countries and candidate countries). The report aims to provide a better understanding of the level of open data maturity in these European countries, capture their progress over time, find areas for improvement, and benchmark countries´ performance against each other.
This data story is the second of a series of data stories focused on the ODM report. While the goal of the first data story was to announce the publication of the report and present its general results, this second data story and those to follow will deep dive into the dimensions of the methodology with real, inspirational examples from specific countries.
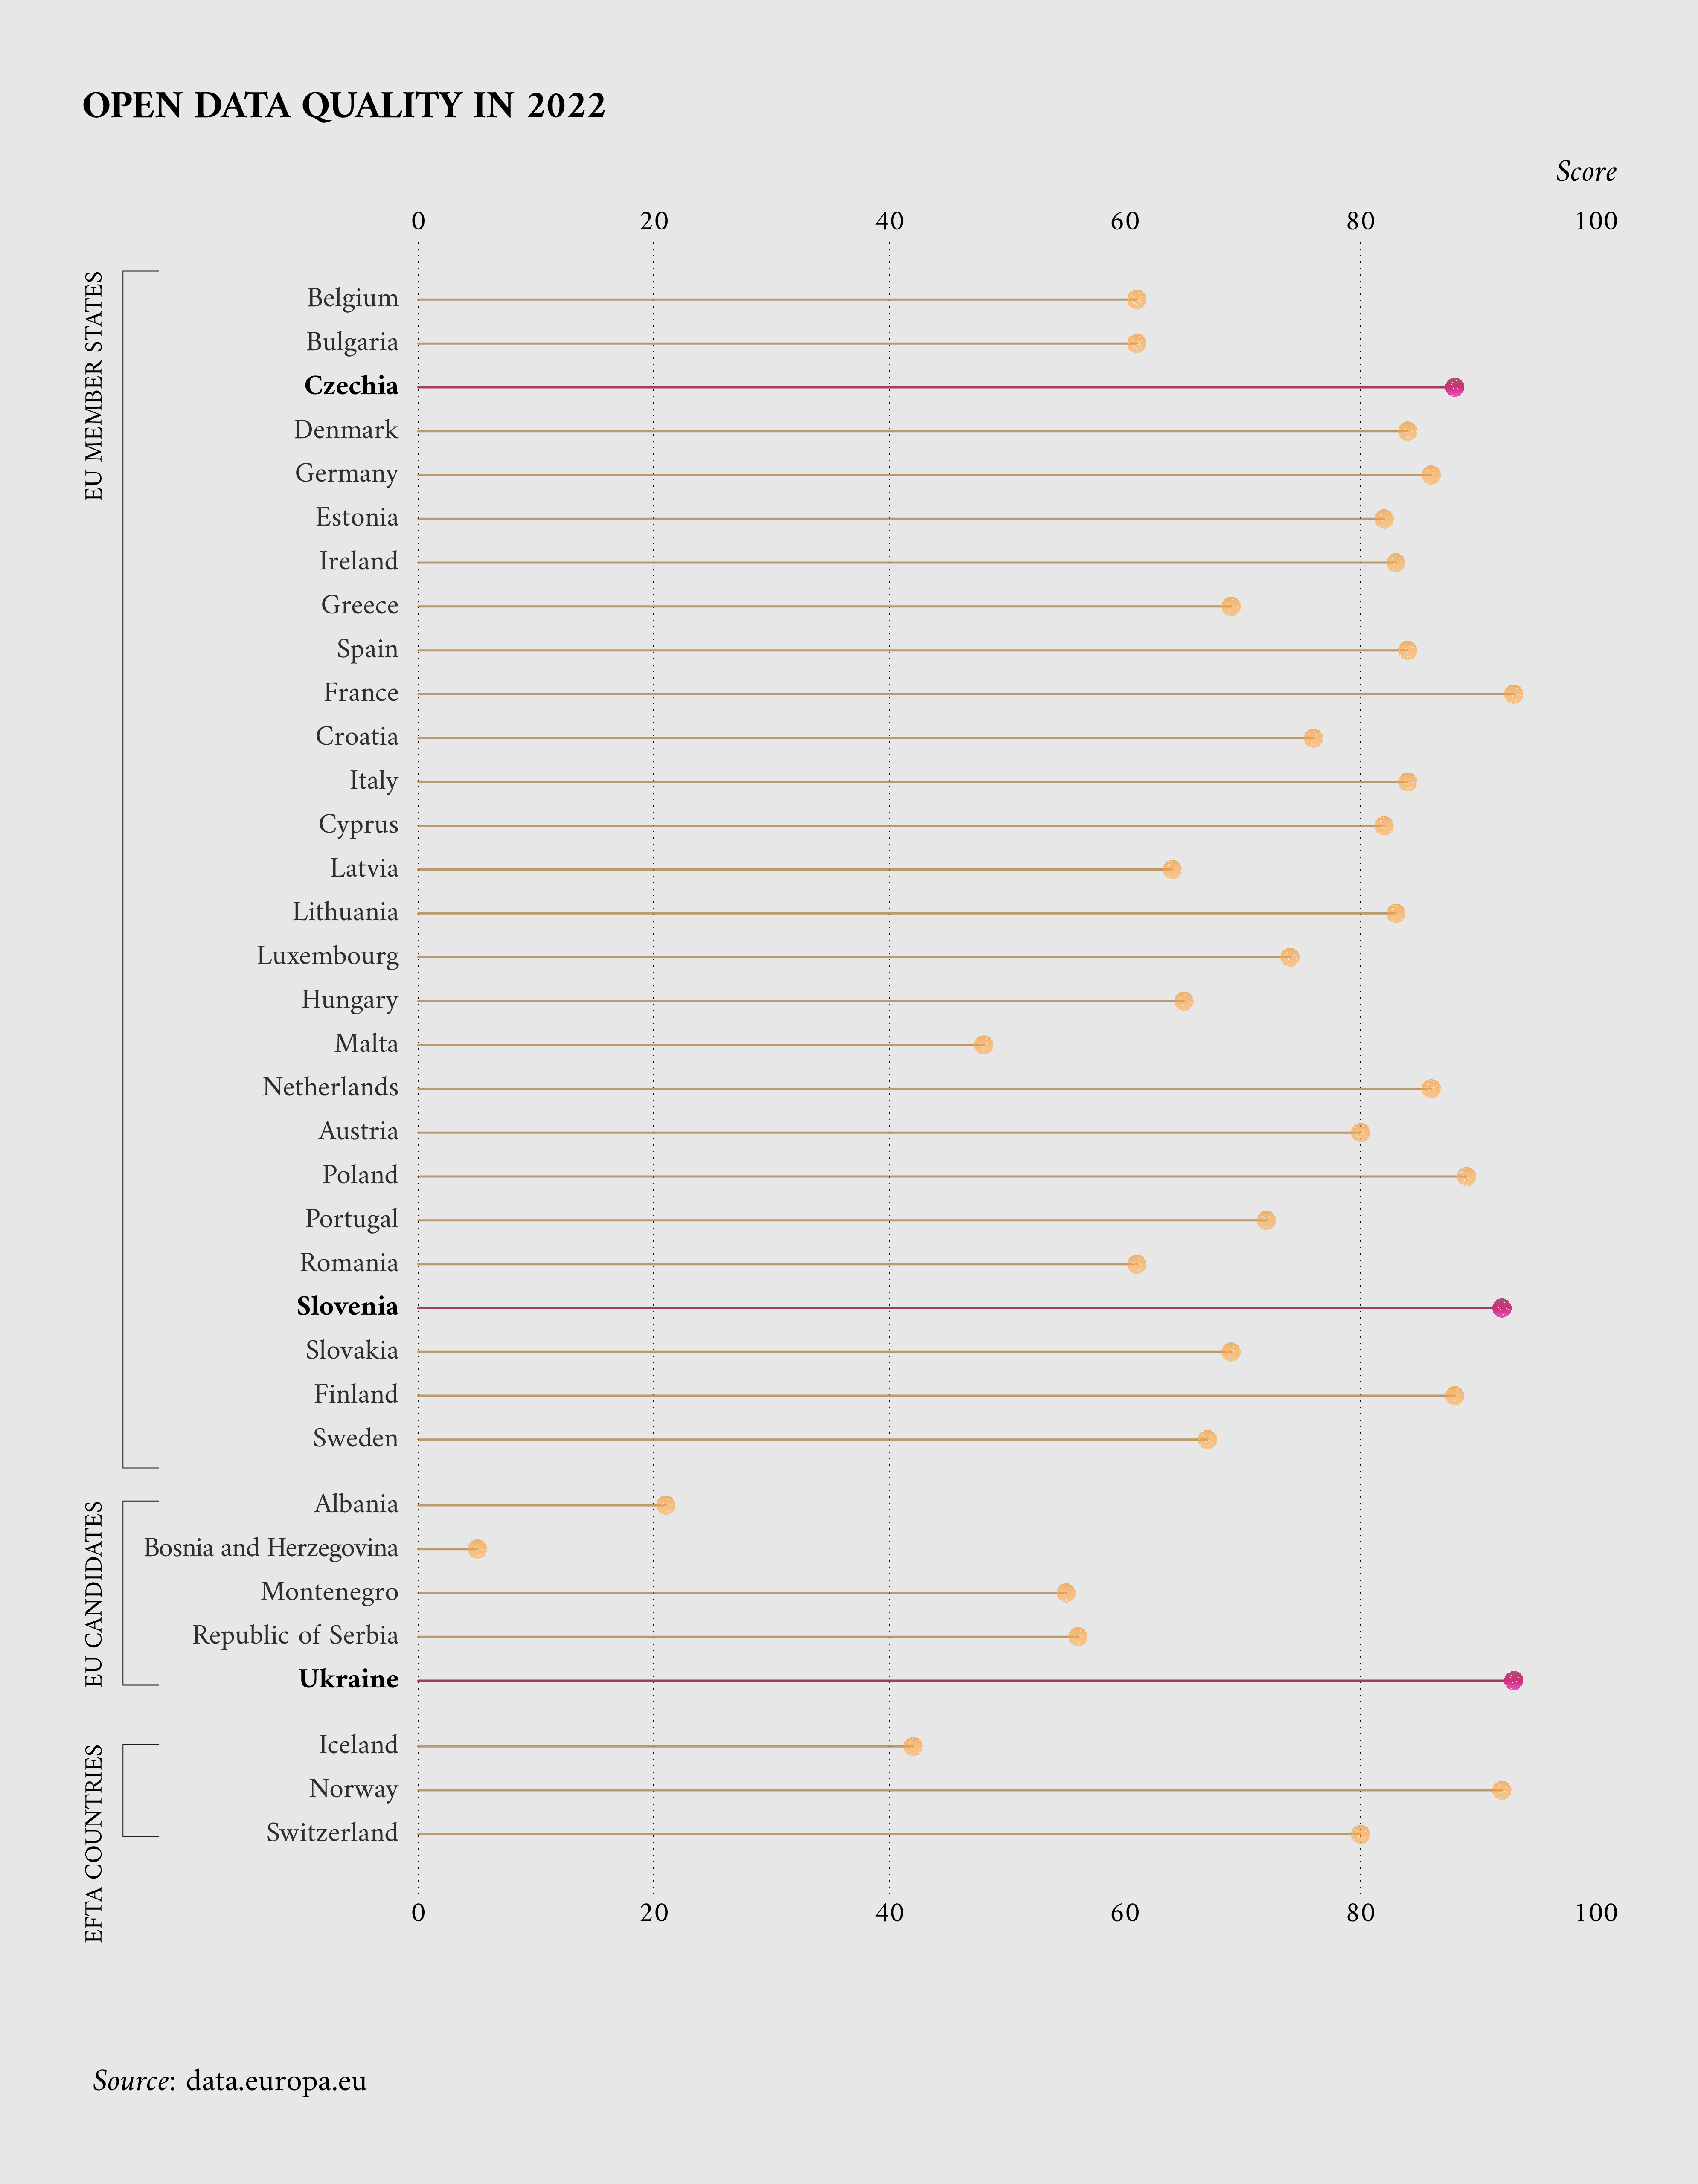
This data story will zoom in on the quality dimension and feature three countries that scored highly and further improved their performance in the ODM quality dimension in 2022. In this context, Czechia, Slovenia and Ukraine, (Figure 1) were interviewed as representing interesting use cases for broader inspiration and boosting cross-learning at European level.

Figure 1: 2022 ODM ranking for the quality dimension with focus on the score of Czechia, Slovenia and Ukraine
The quality dimension in detail
The ODM methodology has been evolving from its first publication in 2015 to accommodate the changes and trends of the European data strategy. In 2018, the methodology grew from two dimensions (readiness and maturity) to four dimensions: policy, impact, quality and portal. While a key index of performance in the early years of the Public Sector Information (PSI) Directive used to be the quantity of data, the quality dimension was added to the ODM in 2018 and became fundamental pillar of the ODM framework.
Since then, the report collects information on the quality of open data from the participating countries through a questionnaire sent to national public administrations. The questions on the open data quality dimension gather information on the steps taken to ensure that the metadata is collected from sources across the country and made available in an up-to-date format and, when possible, with default access to the data. Additionally, the dimension shows the state of play of the deployment of the published data as well as the metadata compliance with specifications, in particular the DCAT-AP profile, i.e., the application profile for data portals in Europe.
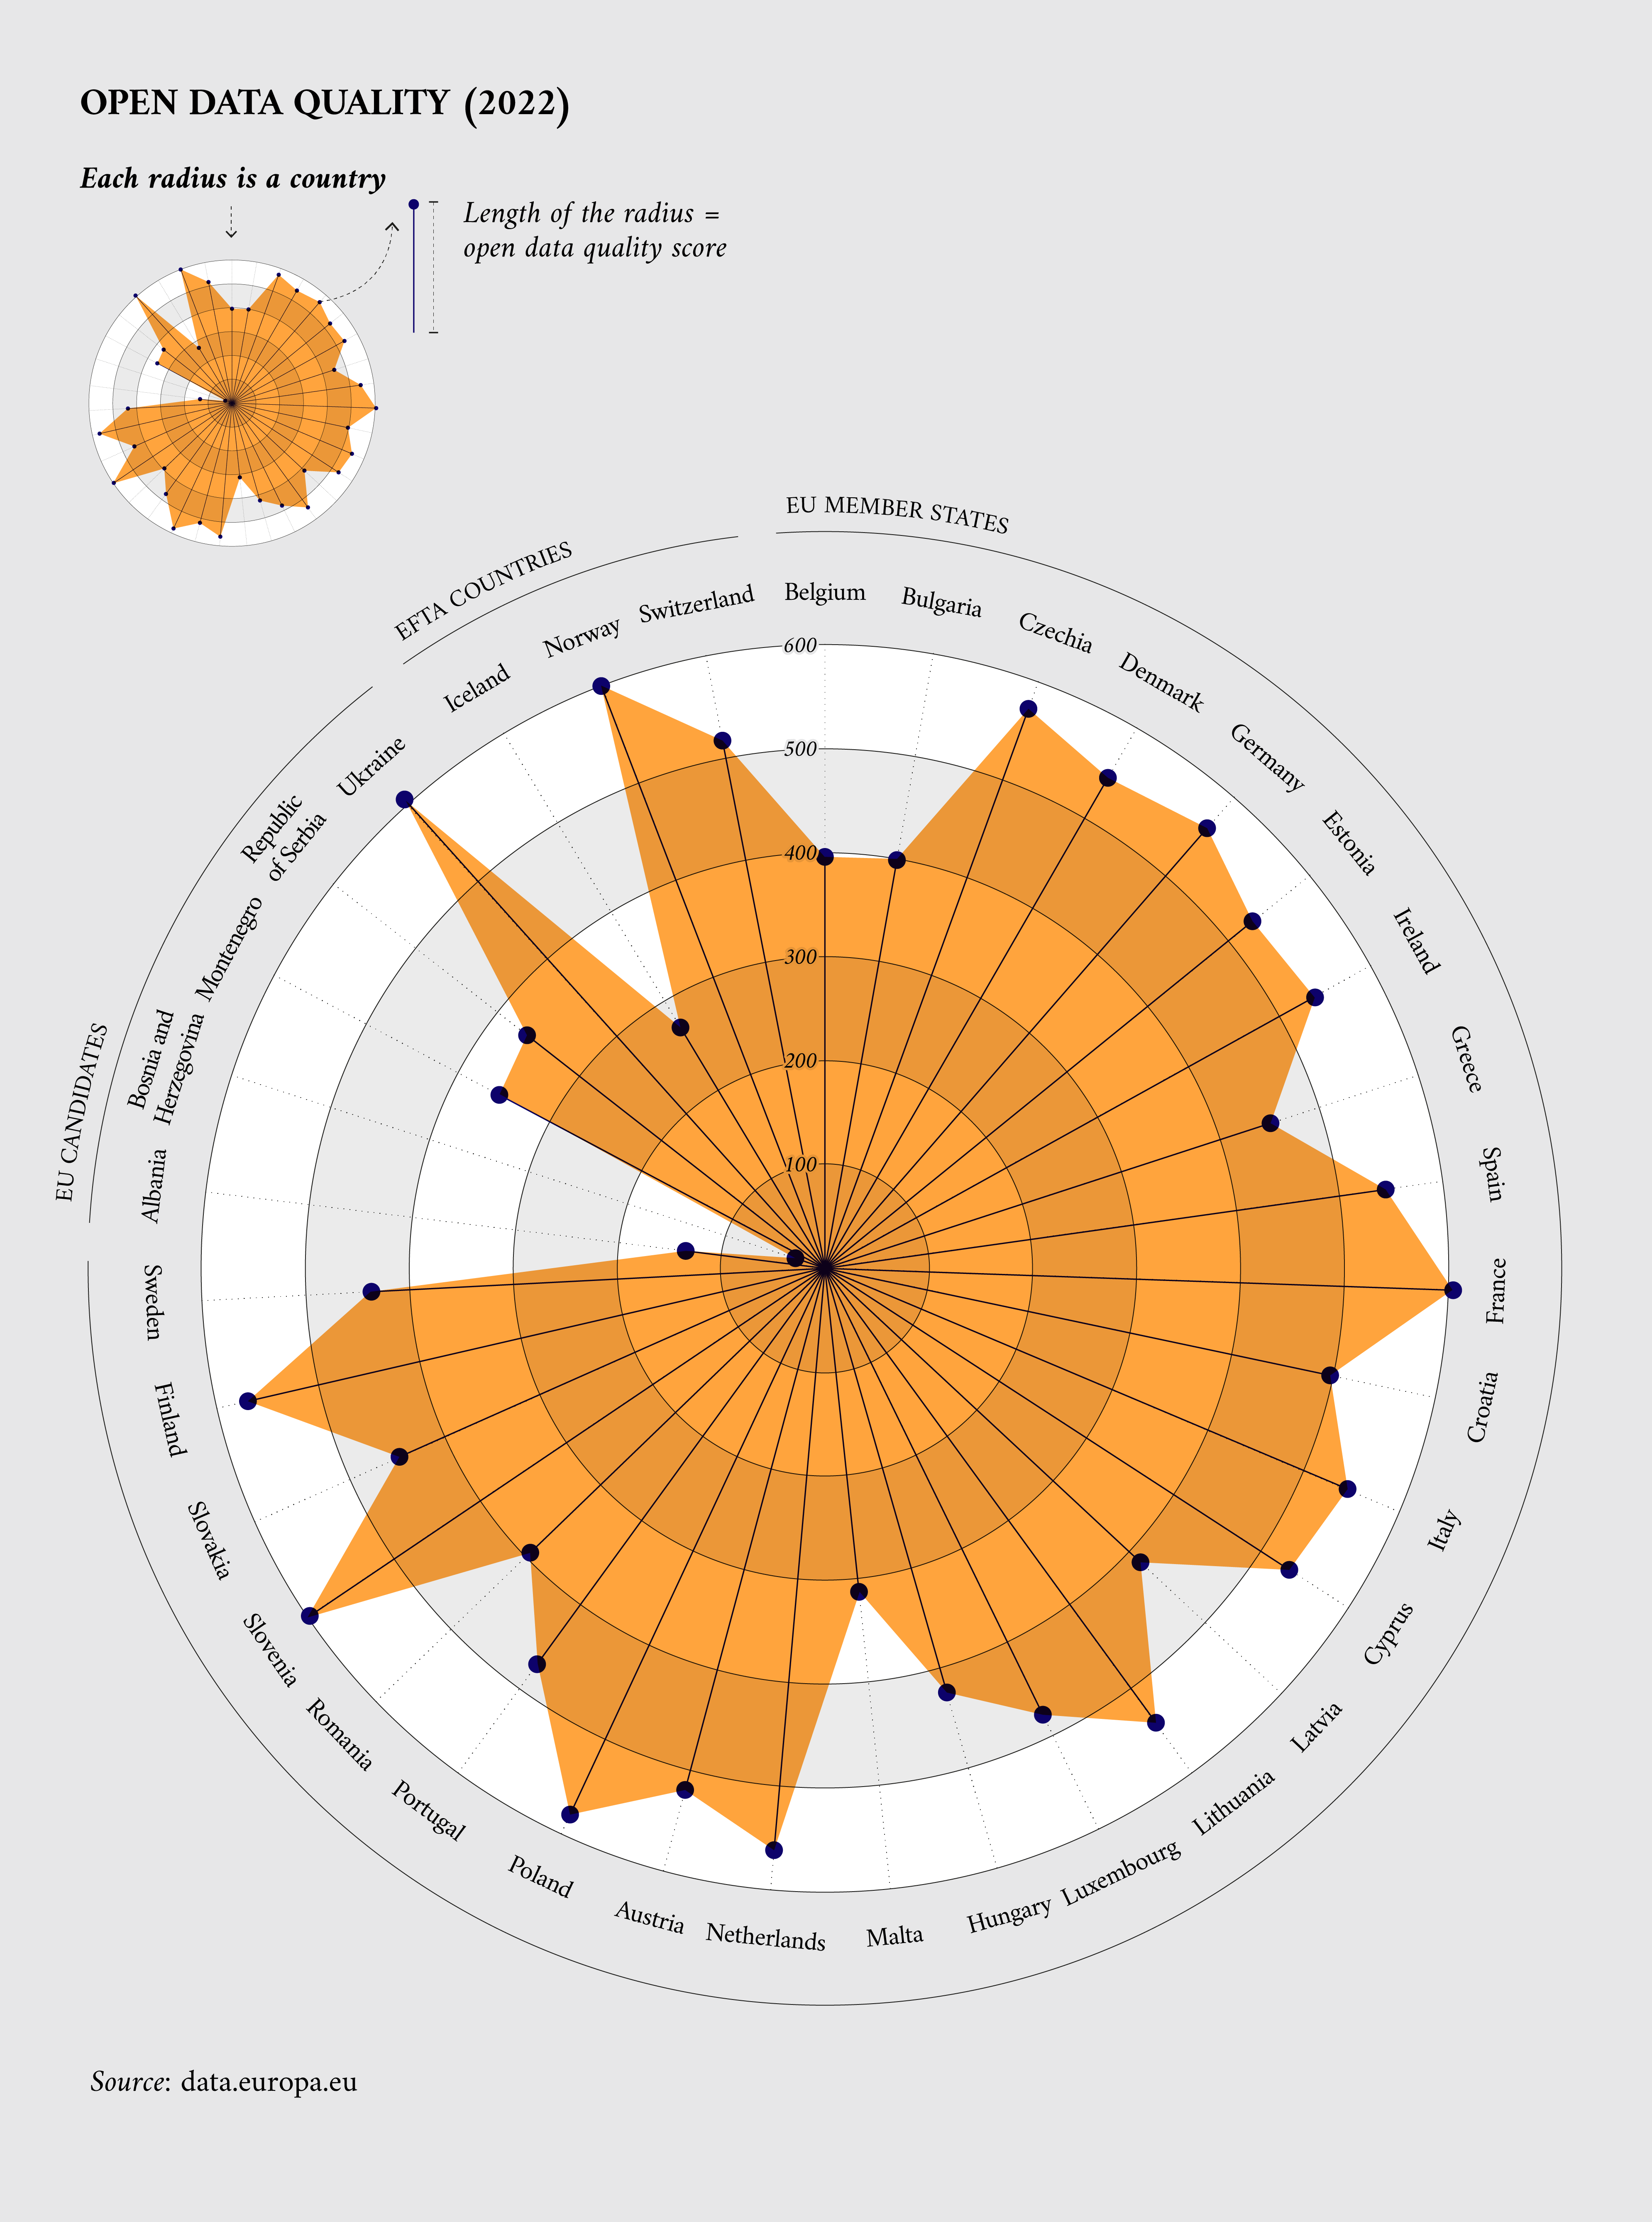
In 2022, the EU Member States’ average maturity score on the quality dimension is 77%, while the average for the 35 participating countries lies on around 72%. This latter represents a slight decrease compared to 2021, when the average quality score for the 35 participating countries was 73%. The authors of the report estimate that this decrease could be attributed to countries publishing a higher number of datasets, for example to prepare for the Implementing Regulation on high value datasets, but without proper attribution or quality checks. In fact, as explained in more detail in the next section, the two indicators that experience a drop in scoring are ‘(meta)data currency and completeness’ and ‘monitoring and measures’. Figure 2 highlights how countries have scored in the quality dimension in 2022.

Figure 2: ODM quality scores in 2022 for all 35 participating countries
Zooming in the quality indicators
The quality dimension is divided in four indicators.
-
(Meta)data currency and completeness
This first indicator focuses on the degree to which countries have a systematic approach to ensure that (meta)data is up to date. According to the Open Data Directive, EU Member States should make datasets freely available, in machine-readable format and through APIs. Moreover, following the publication of the Implementing Regulation on high-value datasets, the EU Member States are required by June 2024 to publish high-value datasets – as defined in the regulation - in machine-readable formats via APIs and, where indicated, also as a bulk download. Meeting these requirements while ensuring interoperability alongside the available datasets from other countries is however still a work in progress. This could explain why there has been a decrease of 6% (from 74% to 68%) points in the overall score for this indicator.
To ensure that (meta)data is up to date and compliant with the above requirements, countries such as Czechia – as reported by Lenka Kováčová (Minister Counsellor at the Ministry of Interior of Czechia) - have published clearly defined APIs for DCAT-AP-CZ, which are compliant and used for local open data catalogues. Another example is the Ukrainian open data portal, which launched a software to undertake automatic checks (using the API) on the completeness and correctness of metadata. At the stage of connecting and synchronising information systems, the availability of the necessary metadata in the dataset is checked and if they are missing, the data provider receives an error message.
-
Monitoring and measures
This second indicator looks at the support, guidelines, and tools available to help publish high-quality metadata and select the best licence type. It focuses on the level of maturity based on a country's effort spent promoting the standardisation of licences. In the scope of the 35 participating countries, this dimension experienced a decrease of 5% (from 84% to 79%) points. This decrease may be due to challenges on data licensing and the fact that this information is not yet up to standard.
Nevertheless, countries are making notable efforts to improve metadata quality. For example, in Czechia metadata quality measurements are displayed on the National Open Data Portal and downloadable as CSV files. Moreover, the metrics that are used to measure quality are included in the SPARQL endpoint of the portal and are part of the user interface for each individual metadata item in the portal. Furthermore, a dashboard to check metadata quality is available for the (meta)data publishers and users of the portal to better understand potential deficiencies. Another example is the Slovenian open data portal, which can provide support to all data publishers if they need help converting xls to open formats. Furthermore, the Slovenian data portal developed the Administration Academy to upskill on how to ensure data quality and 5-start open data scheme, which is available for all data providers.
-
DCAT-AP compliance
The third indicator of the ODM quality dimension focuses on DCAT-AP compliance and the reasons for using it. To encourage data interoperability and discovery, the European Commission developed and promotes the use of DCAT-AP which is a W3C standard design across countries. There has been an increase of DCAT-AP compliance of 6% (from 69% to 75%) across the EU Member States. This could be traced back to technical adaptations, more available information on licences and standards at national level, and further assistance provided to data providers of the national portals. Data.europa.eu has been providing guidance on these technical adaptations.
Ukraine’s national portal supports DCAT-AP standards, and data providers are supplied with requirements on data harvesting. Another example of how countries can support DCAT-AP compliance is in Czechia, where the national open data portal team has published a SPARQL-based filtering tool to go through DCAT-AP compliant records. Here, those who are not compliant do not make it into the National Open Data Catalogue.
-
Deployment quality and linked data
The indicator ‘deployment quality and linked data’ measures, with the use of Universal Resource Identifiers, the quality of data deployment by measuring the amount of machine-readable, structured data made available under an open license. In 2022, there has been a high focus on improving metadata quality. The increase from 64% to 66% in participating countries follows the general trend in the last years.
‘One of the most important components in terms of improving the quality of the datasets is the direct training of data providers to work with open data’, says Mykhailo Kornieiev, head of the open data expert group at the Ministry of Digital Transformation of Ukraine. Their web portal collects materials and useful information for everyone who wants to master this sphere. To support this portal, their open data team constantly conducts face-to-face trainings for representatives of central and local authorities. Czechia has a dashboard on their Open Data Portal, showing the quality of open data deployment over time. Their national open data team monitors the quality improvements, discusses them within the open data working group and describes the quality status in the year-on-year comparison in their annual reports on the state of open data. To ensure the reliability of data, in Slovenia all datasets must first be approved by editors before they are published on the portal. Also, these editors periodically check all datasets and rate them by the 5-star open data scheme.
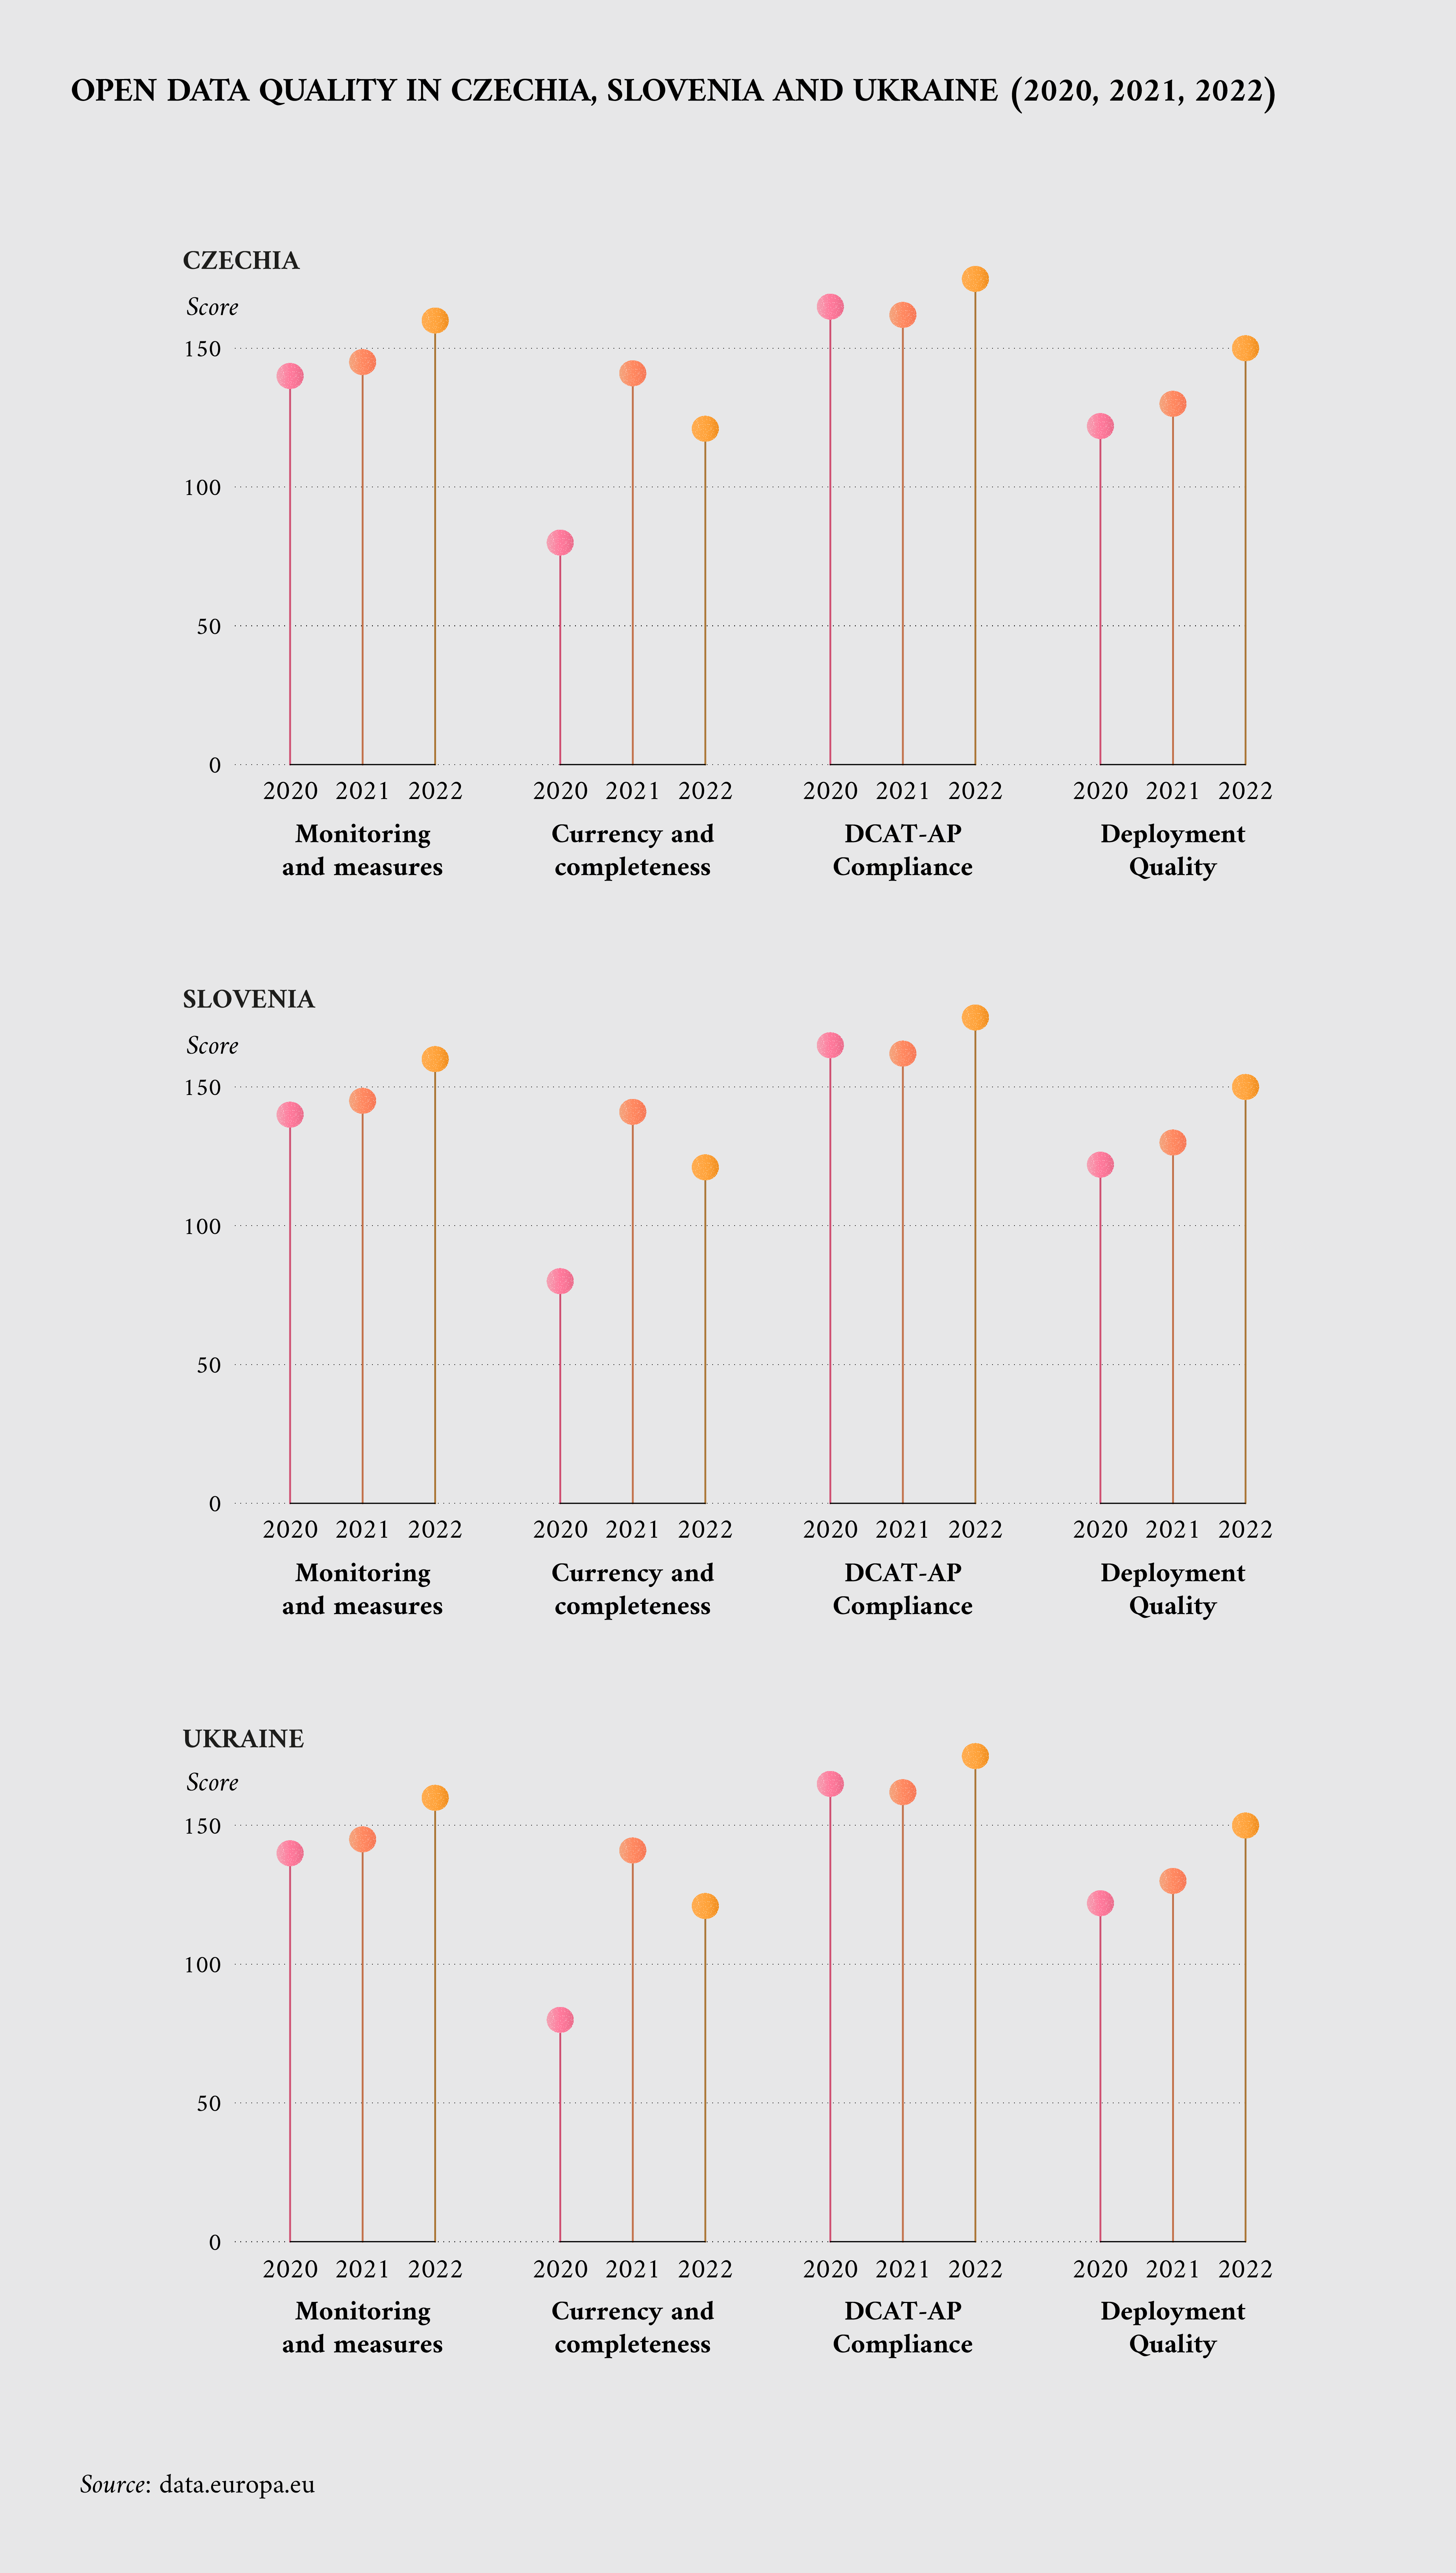
Figure 3 shows the developments in all three interviewed countries – Czechia, Slovenia and Ukraine – from 2020 to 2021. Excluding currency and completeness, a steady improvement can be seen in all quality indicators throughout the years.

Figure 3: ODM quality indicators overtime in 35 countries
Conclusion
Overall, the results for the quality dimension over time clearly show the tendency of participating countries to go beyond considering the quantity of open data made available to focus more and more on the quality of the data published. Yet, between 2021 and 2022, the quality score of the 35 participating countries shows only a partial advancement, maintaining ample room for further improvements. The authors of the report estimate that this decrease within the indicator ‘(meta)data currency and completeness’ could be attributed to an increased focus on ensuring the interoperability of high-value datasets alongside the available datasets from other countries. Within the indicator ‘monitoring and measures’, a possible explanation for the decrease is the increase in volume of datasets and sources whose license information is not yet up to standard. On the other hand, the increase in the indicator ‘DCAT-AP compliance’ may be due to enhanced technical maturity and available information on licences and standards at national level, as well as the assistance supplied to the data providers of the national portals. Finally, the high focus on improving metadata quality and the increase within the indicator of ‘deployment quality and linked data’ follows a general trend of the last years.
The team of data.europa.eu believes that sharing experiences on open data quality across countries is the first step for the 35 participating countries to keep on learning and improving their performance in the ODM quality dimension. This is why on 18 April 2023, data.europa academy will organise its second ODM webinar on the topic of ‘Open Data Maturity 2022: Diving deeper in the quality dimension’. The webinar will host speakers from national open data portals to exchange their views on ODM and quality of open data. If you also want to engage in the discussion, do not miss the webinar and register here!
Interested to learn more about open data quality? Read the ODM report for more insights into the 2022 assessment, explore our interactive ODM dashboard, and the related courses on data.europa academy. And if you are interested in the other ODM dimensions, stay tuned for the next data stories related to this topic.
To stay up to date on all open data matters, subscribe to our newsletter and follow data.europa.eu on social media by clicking on the buttons below.
