Open Data Maturity Report 2022: Countries’ perspectives on their open data portals
Creating a good experience for users and data publishers is key to a good open data portal
Introduction
The Open Data Maturity (ODM) report provides an overview of the progress achieved by European countries as they push forward in creating the necessary conditions to make the most of open data. The concept of open data maturity in Europe is considered against four dimensions: quality, portal, policy, and impact.
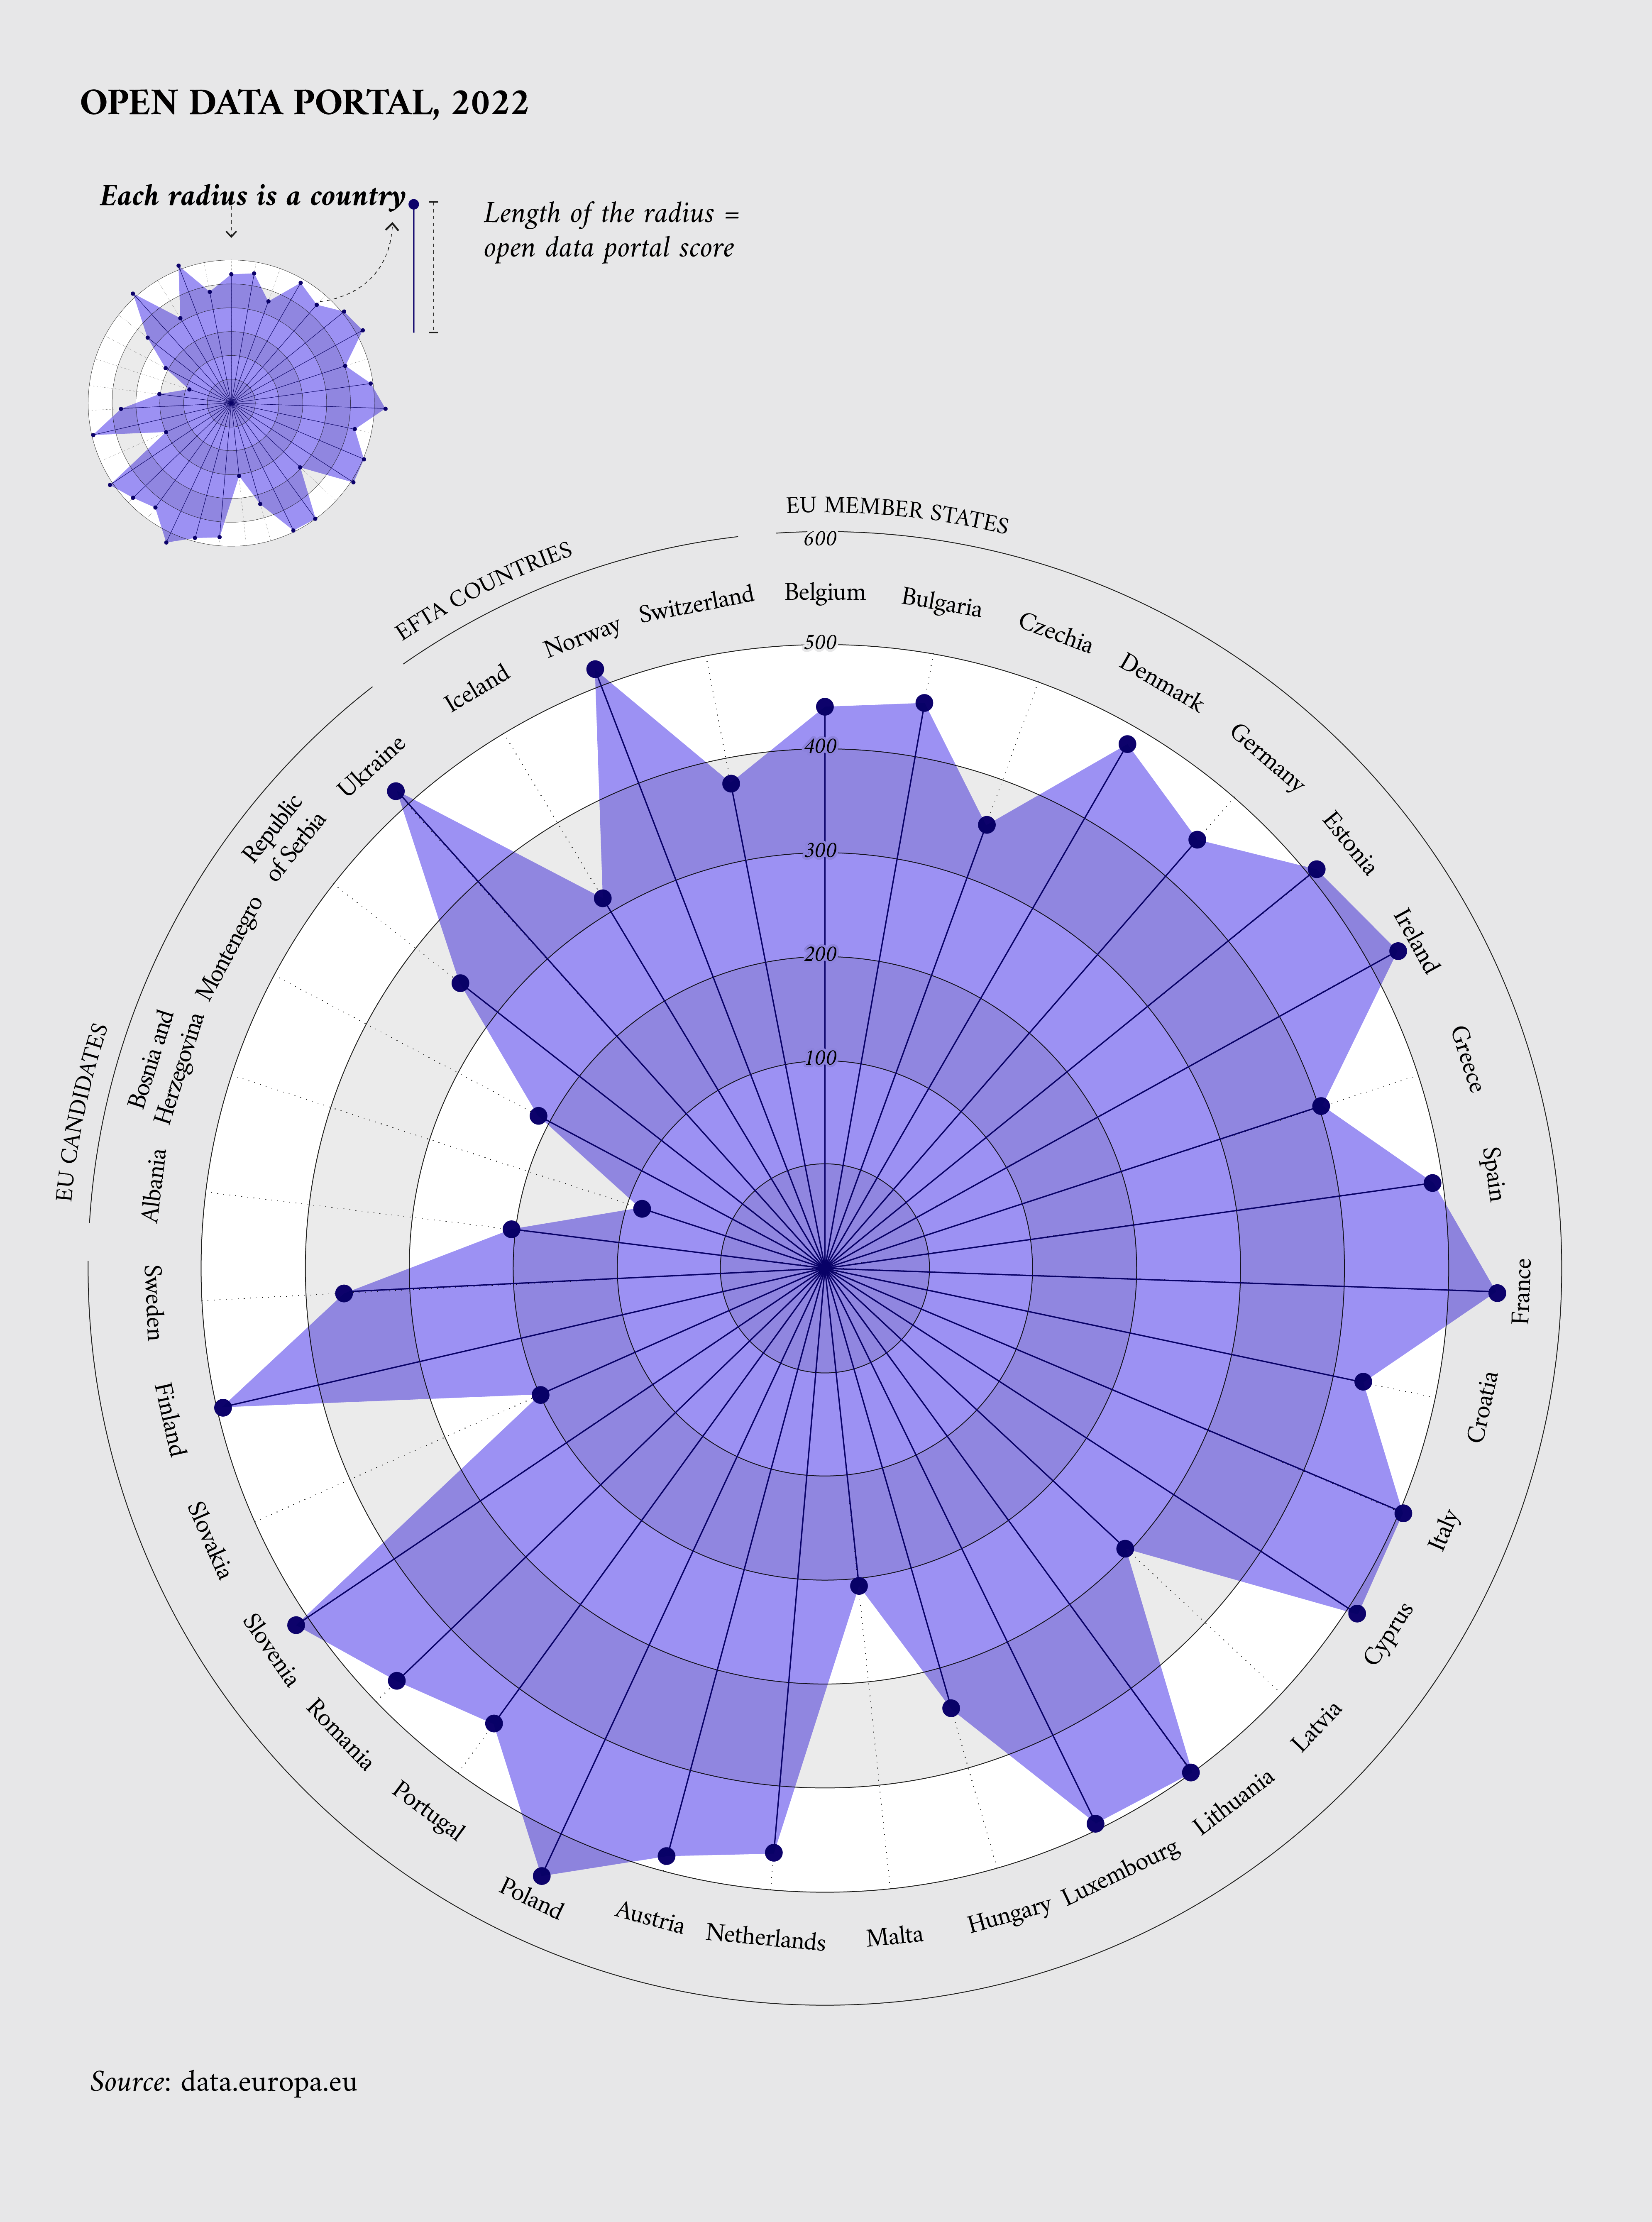
Open data portals are platforms that facilitate data access and reuse. These portals are the gateways for users to turn data into action. Improving the user experience on these portals is therefore key to encouraging data reuse and unlocking the potential of open data. This data story explains the portal dimension (Figure 1) and is the third in a series on the 2022 ODM report. The first data story in the series presented the overall results and the second data story discussed the quality dimension of the methodology.
To elaborate on the portal dimension, this data story features the perspectives of Cyprus, Denmark, and France. These three countries share interesting best practices and reflections on their performance in the portal dimension. First, the portal dimension is explained in overview. Then, the successes and improvement points as reflected by the featured countries are shared. Finally, each of four indicators, namely portal features, portal usage, data provision, and portal sustainability, are considered for their best practices.

Figure 1: Overview of the ODM portal dimension 2022 country scores
The portal dimension in a nutshell
Open data portals are key for Europe’s data strategy because they are the facilitators for accessing and reusing open data: they make data easier to find. These portals also help encourage cross-border use of reusable data in Europe. These portals are intended as single, coherent central gateways to find and access a rich variety of national data that links to the original sources. In this regard, national open data portals also serve the purpose of bringing together datasets from regional and local entities.
The portal dimension of the ODM assesses the maturity of these national open data portals. The dimension assesses several criteria grouped into four indicators:
- portal features: the functions that enable users to access open data through national portals and the features that facilitate the interaction between publishers and reusers,
- portal usage: the use of web analytics to understand user needs and behaviours,
- data provision: the open data coverage of the portal, and
- portal sustainability: measures taken to promote the portal to its target audience.
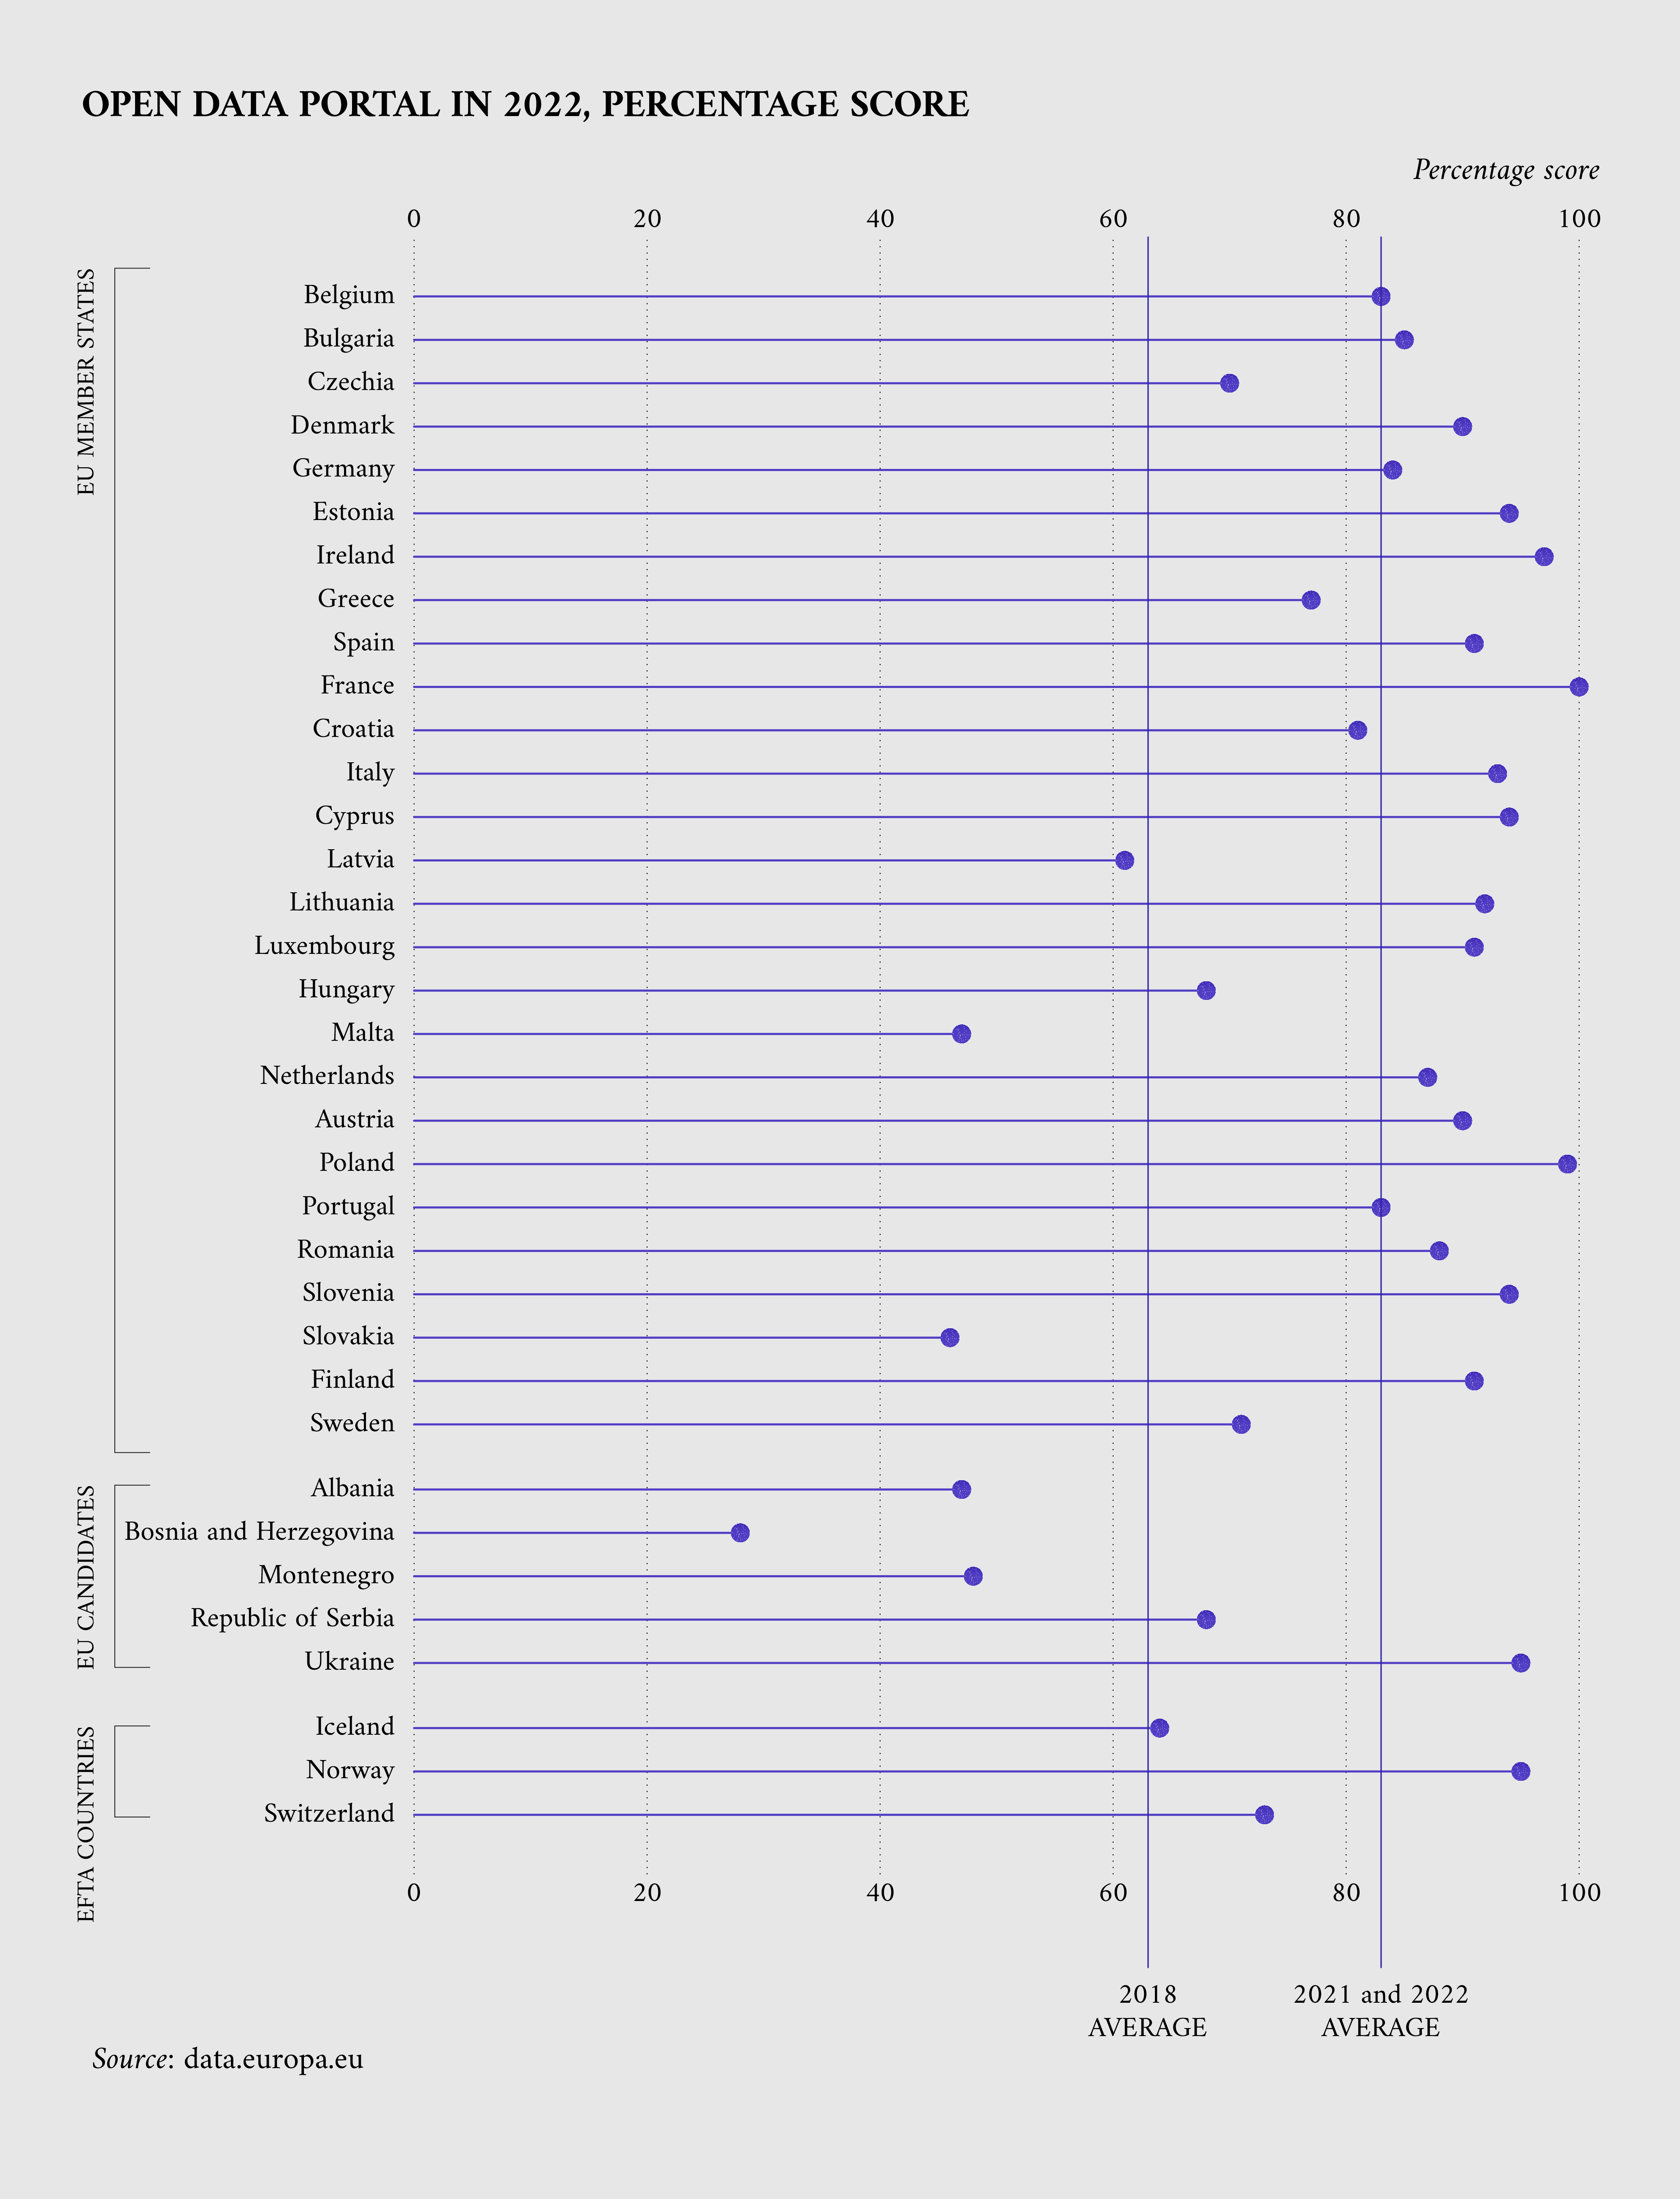
Countries are scored on a list of questions relating to each indicator, which summed together provides a total score for the dimension (full details of the scoring are found in the ODM method paper). Although the portal dimension is the second-highest scoring dimension of the 2022 ODM, the average score for EU27 countries (at 83%) is unchanged from the previous year (Figure 2). However, this is a 20-percentage point increase from the score in 2018 (63%), demonstrating a significant improvement over the long term on this dimension.

Figure 2: ODM portal scores in 2022 for all 35 participating countries showing the 2018, 2021, and 2022 averages
A common strategy for success: users as a centrepiece of open data portals
Although the three countries reflect a good performance on the portal dimension with diverse strategies, they all come to the same conclusion: focusing on the user experience.
France (data.gouv.fr) achieves a good experience for users by having a team “committed to continually improving”. Specifically, the team has made significant progress in improving the technical design (that is, reducing technical debt) of the portal, which allows them to focus more on improving user experience and developing new features. The team works in an agile manner, which enables them to adapt quickly to changing user needs and preferences. For future improvements, one idea the team has is the use of interactive maps, providing a more intuitive way of exploring and analysing spatial data. It is also possible to overlay different types of data on the same map, such as demographic data or environmental data, to allow for more complex analysis. Another future idea is to create personalised experiences for users according to their usage. Examples of such features include personalised recommendations, customised dashboards, or user-specific notifications.
We have also to bear in mind that data publishers are also portal users. The experience of data publishers could also be enhanced through additional tools and resources that help them publish and manage their datasets more efficiently. In this regard, the French open data team sees developing a more user-friendly interface that makes uploading and publishing datasets easier as a future point for improvement. Another is to provide more guidance and support to data publishers through tutorials, documentation, or a help desk.
The Cyprus open data team similarly ensures high performance on the portal dimension by treating the data.gov.cy portal as a “constantly evolving project”. Through feedback surveys and daily interaction with users, together with best practices exchanged with other countries and organisations, they gather ideas on best practices that turn into development plans for the portal. In practice, there are two development cycles. First, an annual (in some cases bi-annual) development cycle for smaller to medium-scale improvements to functionality and features. Second, a 5-year major development cycle which includes major improvements and upgrades that may involve new website design, theming, software, or platform changes, and so on.
In the scope of data publishers, they reflect on how they could reduce the burden associated with the publication of data by increasing the automated harvesting of peripheral data portals and data sources. Another improvement they are considering is adding more features that will make the interaction between users and publishers easier, such as discussion forums within the portal environment.
In the case of Denmark, they have a decentralised open data portal system comprising specialised portals that collect, store, distribute and interact with users within their own fields. Although this decentralised approach brings benefits to data users and providers, it also presents challenges in how to find relevant data. To improve the user experience, Denmark decided to create a national data portal in 2022, Datavejviser, therefore complementing domain-specific portals. By using several key pieces of metadata from domain-specific providers, the national data portal enables users to identify and evaluate datasets relevant to them, guiding them to domain-specific sites.
But the Danish portal also has plans for the future based on user feedback. They highlighted three areas of improvement in their work to add more and better metadata to its catalogue. One feature that users request is the ability to combine datasets from different domains. Better metadata is only a partial solution to this request, but a first step will be to highlight how available data is already combinable. The second area for improvement is better labelling of data quality. To address this, the open data team is investigating the best way to implement a common language for data quality on the portal in a way that is interoperable in a European context. The third area of improvement is easing the burden of metadata requests on their data providers by reusing as much metadata as possible that providers are already sharing for other purposes. At present, the team is looking into mappings between the DCAT standard for metadata and other standards such as the one required by the INSPIRE directive.
The portal dimension in detail
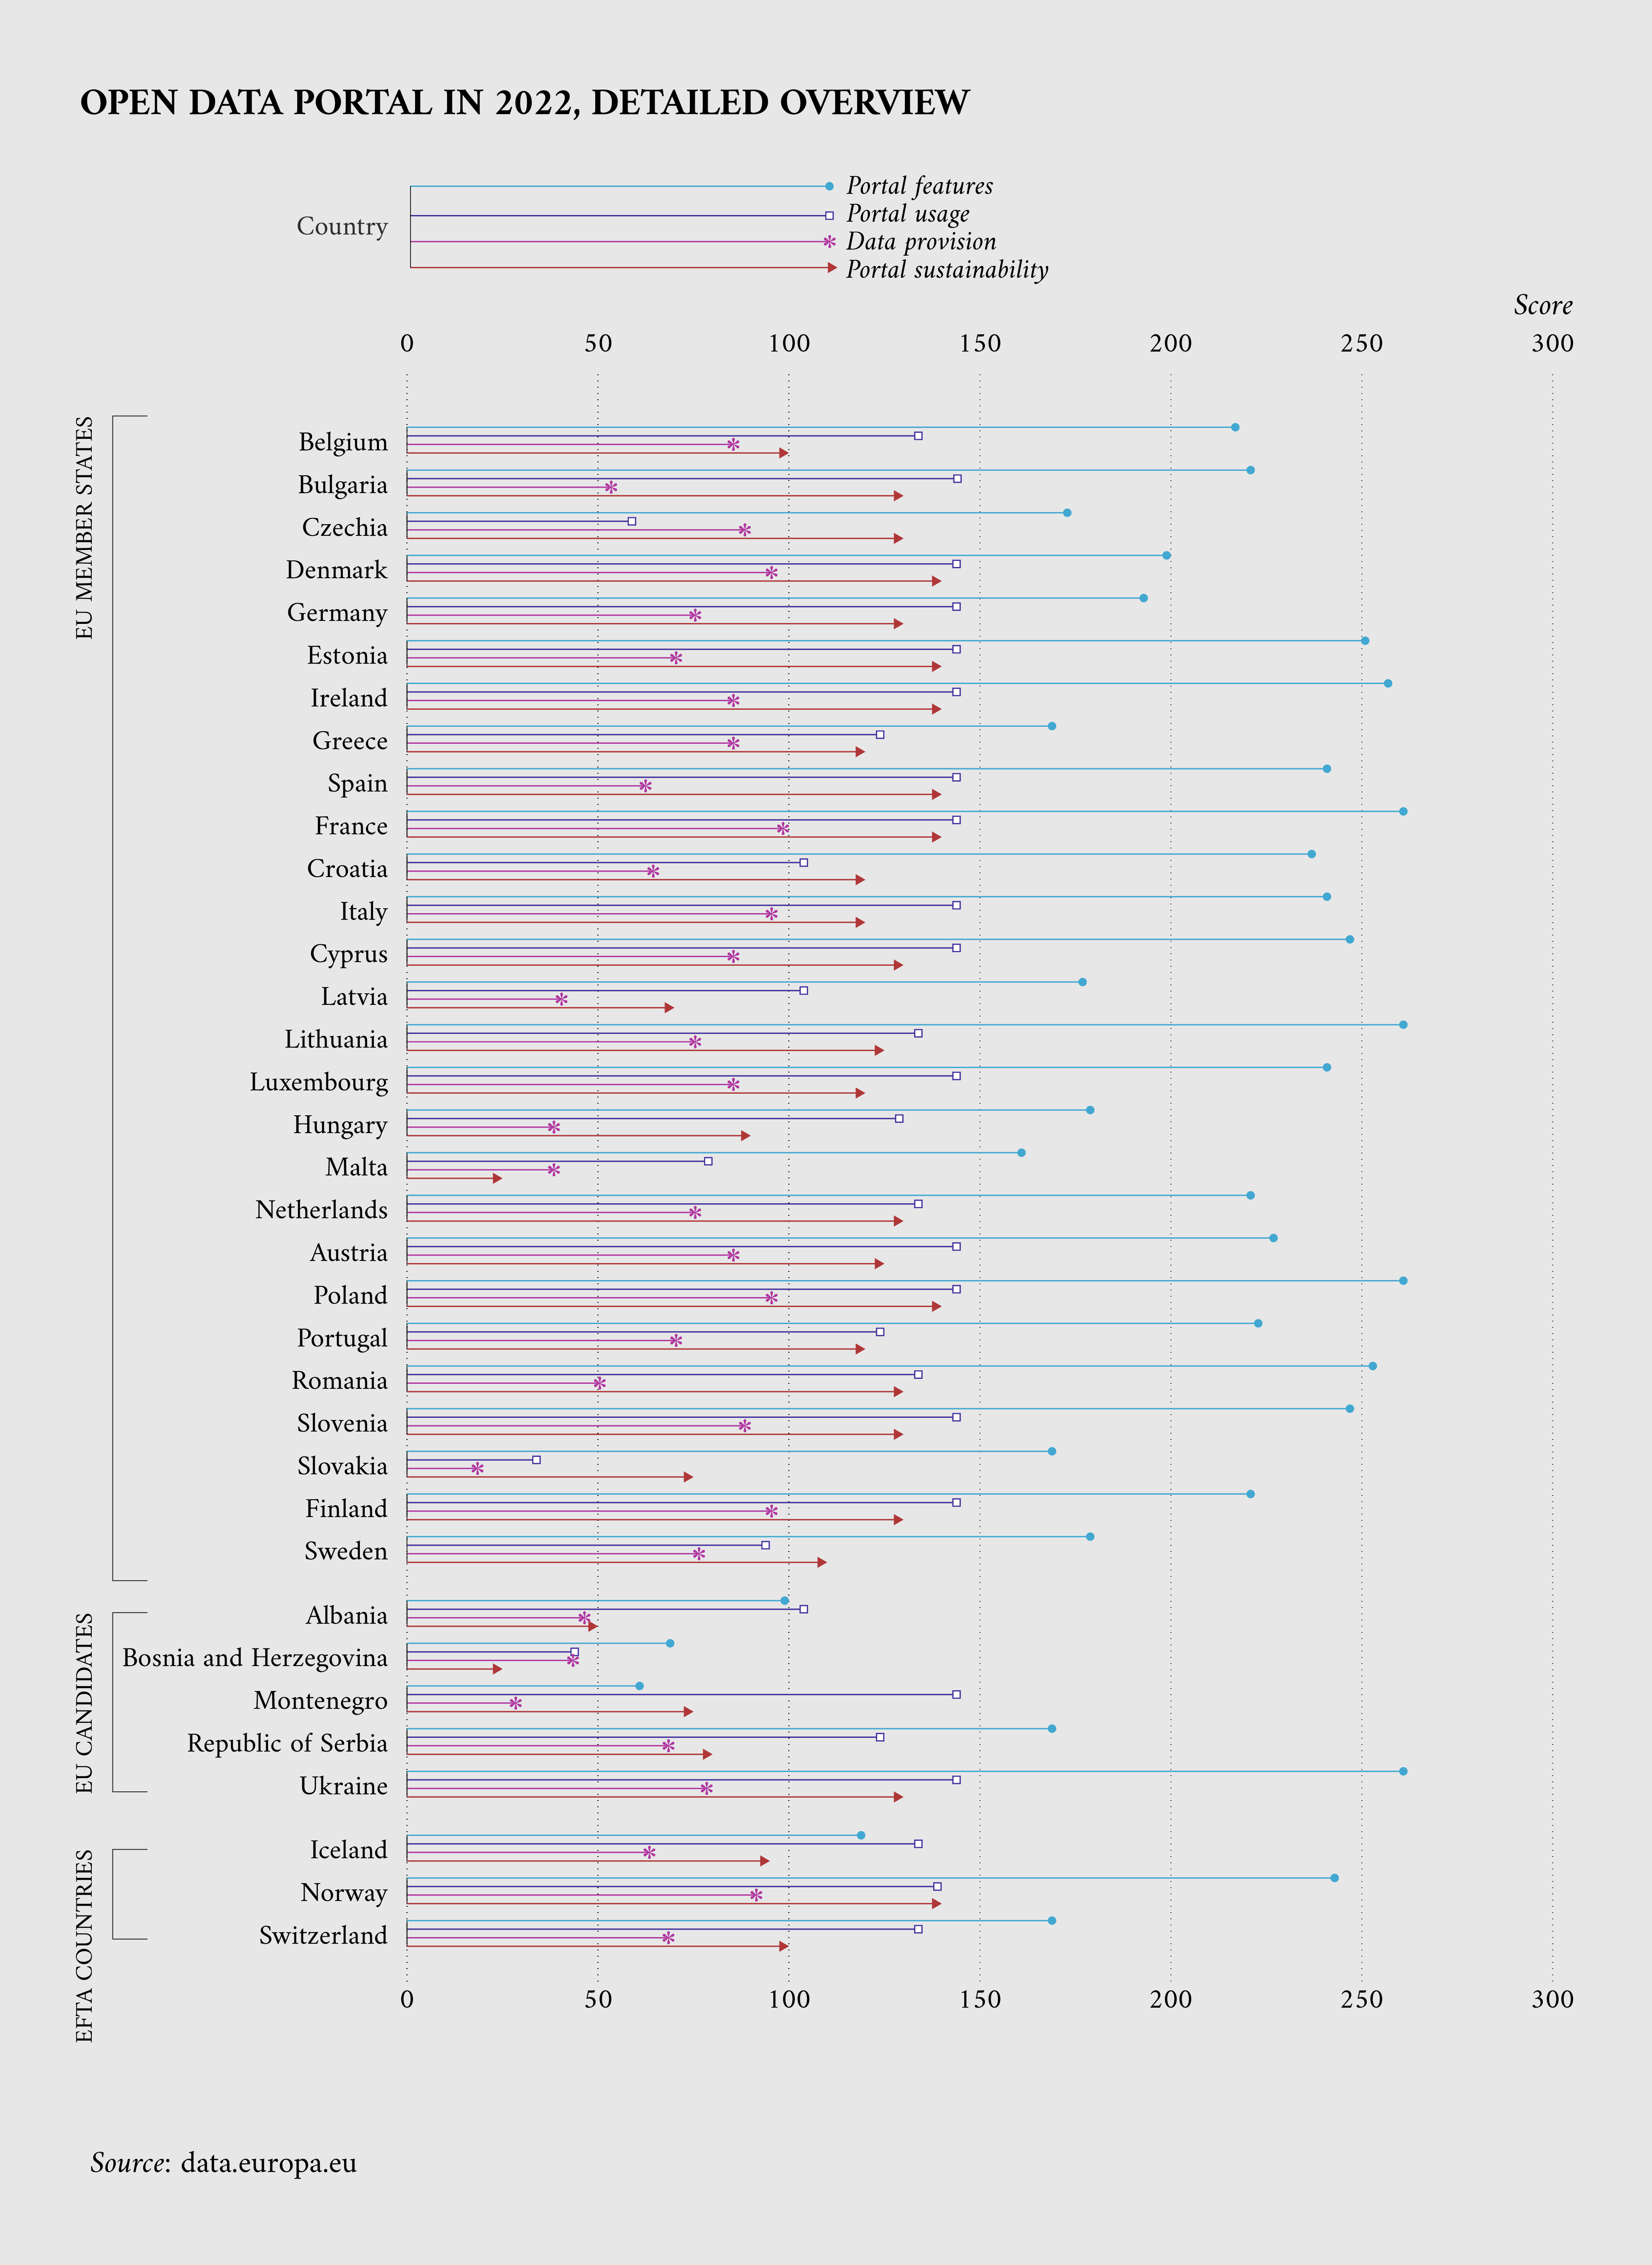
In addition to their self-reflections on their overall performance on the portal dimension, the three featured countries also share their best practices for the four indicators of the portal dimension. Figure 3 provides a detailed overview of countries’ scores per portal indicator in 2022.

Figure 3: ODM ranking on the four indicators of the portal dimension in 2022 for all 35 participating countries.
- Portal features
The portal features indicator evaluates the functionalities provided on national open data portals. These functionalities include the ability to search for and request datasets and the presence of features that promote transparency, interaction, and open data reuse.
The national open data portals that tend to perform well on this indicator typically provide users with features that go beyond simply finding datasets. This is the explicit aim of the Cyprus national portal. Beyond enabling users to search for data, Cyprus’ portal serves four additional functions. These additional functions include (1) showcasing use cases and open data impact, (2) enabling users to request datasets (>95% of data requests are submitted through their portal), (3) providing information and education on open data issues in Cyprus and the EU (editorial section), and (4) providing support to both publishers and re-users.
The French open data team has also implemented advanced features. The specific aims of France’s portal are improving data discoverability, data quality, and data understanding. This includes providing editorial content, such as blog articles and newsletters, that guide users towards the most relevant datasets. Another advanced feature is a tool, explore.data.gouv.fr, that allows users to explore tabular datasets, helping them gain insights into data and better understand its context. Finally, the team also uses metadata quality as a feature. Datasets are labelled with a metadata quality score. This score helps re-users find relevant datasets. It also has the additional impact of incentivising data publishers to improve data quality.
On the other hand, the Danish national portal assessed the Danish distribution landscape and discovered that many of the recommended, advanced portal features are already available at the websites to which the national portal leads its users. Therefore, the national portal was designed to be a guide to these domain-specific sites. The Danish team focuses their efforts on the quality of the metadata entering their database since the reliability of metadata is one of the most important user demands. Furthermore, many of their ideas for future functionalities require high-quality metadata to work properly.
- Portal usage
The portal usage indicator evaluates the extent to which portal providers monitor and analyse user behaviour on their portal. This includes the collection of user analytics, monitoring the number and location of portal visitors, understanding the popularity of categories of content, and monitoring application programming interfaces (APIs). These are essential elements to understand the behaviour of users.
The Cyprus open data team attributes its high visitor numbers partially to the substantial communication work it has undertaken to actively promote the national portal. This promotional work includes hosting events, conferences, and workshops as well as using social and mainstream media. The French open data team uses portal usage statistics and surveys to define users’ profiles, behaviours and needs. They then direct user groups to relevant reuses and services. The Danish open data team collect data on user behaviour through Matomo to ensure that the data is not shared with third parties. The team uses this data, as well as written and verbal feedback and questions from users, to prioritise future metadata acquisition and improvements.
- Data provision
The data provision indicator evaluates the extent to which data publishers contribute to national open data portals and what actions are taken to foster their contribution. The three featured countries offer a variety of best practices that reflect their national contexts.
In Cyprus, most public service bodies under the central government contribute data to the national portal. This is achieved through a law that obliges that specific data produced by public service bodies, municipalities, and legal entities be made available through the national open data portal. Through its 2023-2027 Open Data Strategy, Cyprus also aims to gradually enrich its national portal with selected data from non-governmental organisations. They emphasise data from organisations and companies that are active in the fields of sustainable mobility and green development, as well as data that can contribute to smarter and cleaner cities and a better quality of life.
The Danish national portal only publishes descriptions of data from the data providers coming from the public sector. The catalogue is expanded continuously through the onboarding of additional data providers. When choosing which data providers to onboard, user demand and present political priorities are used to evaluate their importance. Furthermore, the reliability of metadata is a high priority for the Danish open data team. They want to ensure that the metadata they publish is an accurate and up-to-date representation of the data from data providers. To achieve this, the Danish portal develops integrations that enable the automatic harvesting of metadata from reliable data providers. Therefore, the portal needs to have clear agreements with data providers on expectations concerning the maintenance of metadata.
Alternatively, the French data portal is an open collaborative platform where anyone can publish and access data. This has resulted in a diverse range of users that contribute to and benefit from data. In this context, the French open data team performs daily curation work that prevents inappropriate content from appearing on the portal.
- Portal sustainability
The portal sustainability indicator evaluates the strategies to ensure the long-term sustainability of the portal. This indicator also assesses the measures in place to ensure that the portal caters to the needs and brings added value to its main audience.
For the Danish open data team, the key to long-term sustainability is the creation and management of standardised and interoperable metadata. For this to happen, the open data team recognises that they must provide technical solutions and practical guidance that fit data providers’ needs, such as how to best interpret and implement DCAT-AP. The team also advocates the importance of prioritising metadata from the start whenever the public sector launches new investments in data.
Funding is also a key consideration for the operational and technical sustainability of national portals. In Cyprus, the country’s Open Data Strategy includes the national portal as one of its four pillars. This strategy grants a long-term funding agreement for the development, hosting, and maintenance of the national portal. Funding strategies and securing the required budgets in the medium term are the responsibility of the open data team and the Public Administration and Personnel Department. To secure financial sustainability, the open data team periodically commissions impact studies to collect evidence that support the business case for funding the project.
Thinking in terms of a business case, the French open data team underline that their national portal is recognised as an impactful product with a well-defined team. This strongly supports the sustainability of the portal and has granted the open data team more autonomy over the product development and strategic direction of the portal. The open data team believes this will likely result in even more improvements and innovations in the future.
Conclusion
Overall, most participating countries in the ODM have worked over the years to make their national portals functional and engaging for users and data publishers. The experiences and insights provided by Cyprus, Denmark, and France can be a source of new ideas and practices for other countries to continue enhancing their national portals, as relevant to their national contexts.
For the featured countries this especially means focusing on the user experience. Importantly, both data users and data publishers are users of national portals. Successful portals cater to the needs of both these groups to encourage the demand and supply side of data sharing. Top portals go beyond basic functionality to enhance the ways data users can discover, access, and use open data. For data publishes, a good portal provides a reduced burden in the publication process. Beyond the technical functionalities of portals, communication is key. Top performing portals consider user feedback and provide ways for users and publishers to interact.
Data.europa.eu supports the sharing of experiences among national open data providers to enable countries to keep learning and improving their open data maturity. The data.europa academy is hosting a webinar on the portal dimension on 14 July 2023. The webinar will host speakers from national open data portals to exchange their views on ODM and portals for open data. Register here for the webinar.
Interested to learn more about open data? Read the ODM report for more insights into the 2022 assessment, view our interactive ODM dashboard, and explore the related courses on the data.europa academy. And if you are interested in the other ODM dimensions, stay tuned for the next instalment in this series. Keep up to date by subscribing to our newsletter and following data.europa.eu on social media.
Many thanks to Dimitris Michail (Cyprus), Christian Nicolai Larsen (Denmark), and Thanh Ha Le (France) for their contributions to this data story on behalf of their national open data teams.
