The COVID-19 related traffic reduction and decreased air pollution in Europe
The restrictive measures taken by European governments lead to a sharp decrease of air and road traffic. European data-driven insights indicate that the reduction of traffic may be associated with improved air quality thanks to the reduction in some pollutants. However, more data is needed to conclude a causal relationship.
In order to flatten the curve of the rapid spread of COVID-19, many countries implemented restrictions such as closing schools, factories, and offices as well as cancelling public events. For information on the restrictions implemented by countries read our data story about the Oxford Government Response Tracker. In many countries, these governmental measures include a request for citizens to stay at home as much as possible and travel restrictions. As a consequence, there has been a massive reduction in traffic on the roads as well as in air transport (e.g. the number of European daily flights in March and April decreased by approximately 90% compared to last year). While these developments have an acknowledged social and economic impact, there might be a potential positive – though short-term – side-effect in terms of environmental benefit. Note: by talking about potential positive effects for the environment, the EDP for COVID-19 editorial team does not want to downplay the disastrous effects of the COVID-19 situation to individuals or society at large in any way or form.
Currently a significant change in air and road traffic can be observed as opposed to the “normal” pre-crisis situation. To visualise the severity of the reduction in traffic and the impact the governmental measures have worldwide, there is data available that allows for comparing traffic during the COVID-19 pandemic with traffic from previous years.
Traffic Tracking Initiatives
Air traffic – EUROCONTROL, Europe-wide
The European Organisation for the Safety of Air Navigation, commonly known as EUROCONTROL, is a pan-European, civil-military organisation dedicated to supporting European aviation. It is the central organisation for coordination and planning of air traffic control for all of Europe. The data used by EUROCONTROL reflects 41 countries, including all EU Member States. They created a COVID-19-dedicated website where they publish data-driven insights on the impact the pandemic has on air traffic. They display several comprehensive interactive visualisations that compare current European air traffic with that of a year ago, see figure 1.
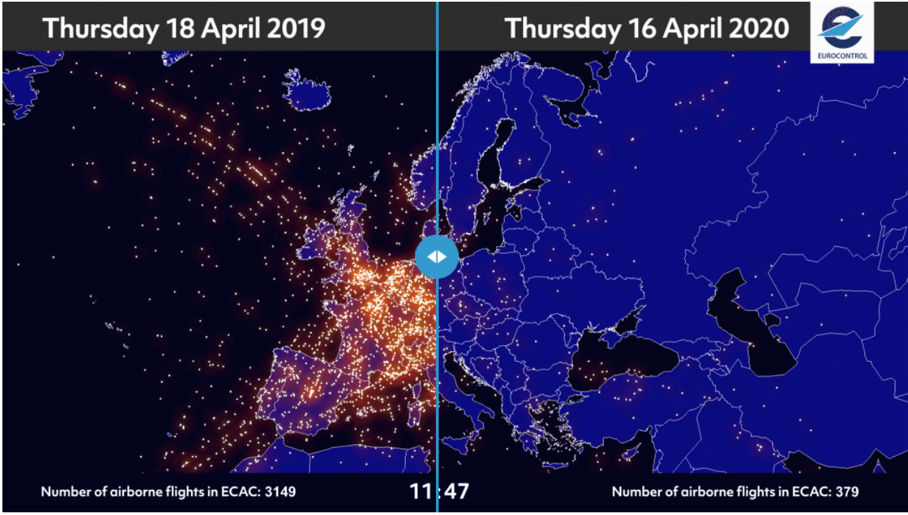
Figure 1: Screenshot of interactive overview presenting the differences in the amount of air traffic of this year compared to last year.
In addition, EUROCONTROL offers data insights in two forms. A dashboard that presents the daily variation of the European aviation network per state that compares air traffic today with last year, shown in figure 2. Also, an assessment report is available on the impact that COVID-19 has on European air traffic.

Figure 2: EUROCONTROL’s COVID-19 dedicated dashboard visualising daily traffic variation.
Furthermore, EUROCONTROL offers a pan-European Air Navigation Services (ANS) performance data portal, where monthly data is openly available to the public. This portal offers, in addition to the open data, high level insights of the crisis and publishes aviation performance reviews (e.g. number of flights, delays, cost-effectiveness, etc.) once more data becomes available. An example of their insights can be found in figure 3.

Figure 3: Evolution of daily flights, comparing the COVID-19 crisis to the volcanic ash crisis in 2010.
Road traffic – Rijkswaterstaat, the Netherlands
When looking into European-wide data dedicated to road traffic, it is noteworthy that these datasets are limited or only aggregated at yearly level. Nevertheless, there are some datasets on national level that estimate the road traffic in the current situation.
The Dutch Rijkswaterstaat, part of the Dutch Ministry of Infrastructure and Water Management, collects data on the main infrastructure facilities in the Netherlands. For example, the speed and the number of vehicles on the national main roads are measured on a daily basis as well as data on traffic congestions in terms of length, duration, etc., which is publicly available. The data is normally processed for historic data series and statistics, but now lends itself for a clear pre-crisis versus crisis comparison of traffic congestions in the Netherlands. The data is open for everyone and can be downloaded here. The European Data Portal for COVID-19 editorial team created a graph showing the traffic congestions in the Netherlands for the first months of the last three years. Throughout week 11 the measures were announced by the Dutch government and were all enforced from week 12 onwards. The graph indicates that the Dutch restrictive measures heavily affected the traffic jam intensity in the Netherlands.
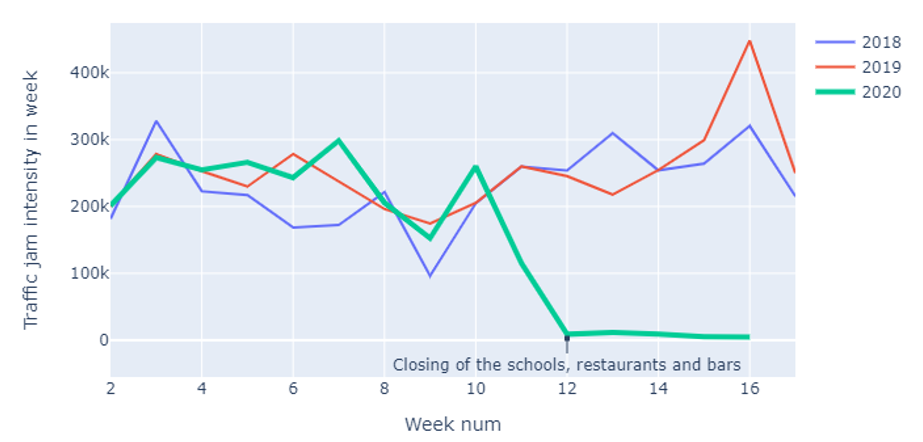
Figure 4: Traffic jam burden in the Netherlands from the last three years, showing the effect the restrictive measures have.
Overall, the data provided by EUROCONTROL and the Dutch Rijkswaterstaat show a significant reduction of both air and road traffic at times of restrictive measures taken by European governments. In situations of prolonged lockdown, the expectation is that average levels of air pollution will go down. Several initiatives are already established by European institutions to present the effect the European lockdown has on air pollution.
Air Pollution Tracking Initiatives
European Environment Agency
The European Environment Agency (EEA) has developed a viewer that tracks how the reduction in transportation affects the concentration of air pollution. They use weekly updated data from EEA member countries to show that the concentration of nitrogen dioxide (NO2) (a well-known pollutant emitted by road transportation) decreased in many European cities where restrictive measures have been implemented. The viewer that tracks the weekly average concentrations of NO2 and particulate matter (PM10 and PM2.5) is shown in figure 4. To clearly visualise the effect the reduced traffic has, the EEA shows the level of air pollution compared to last year.
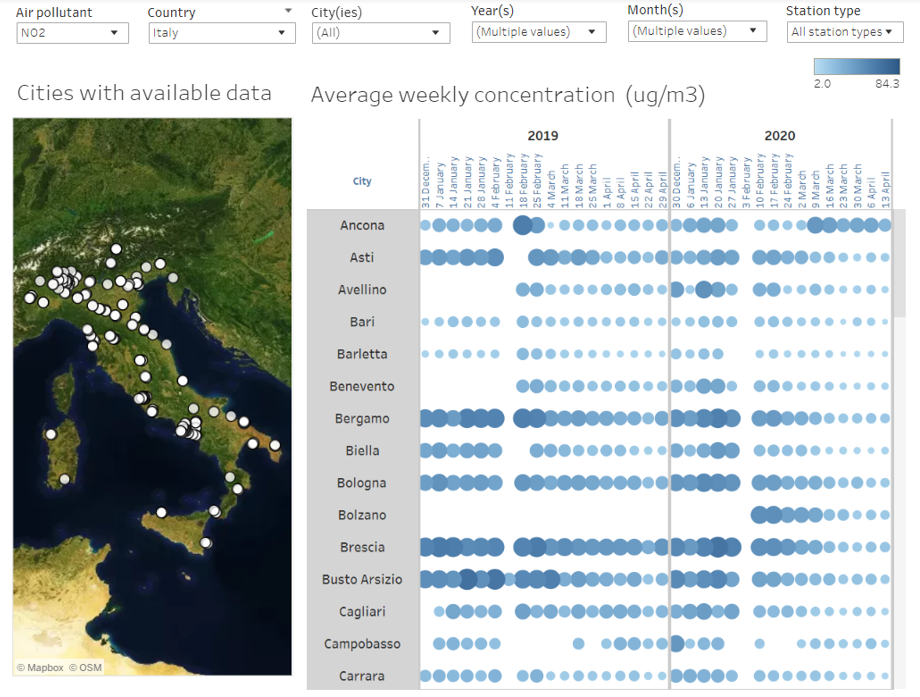
Figure 4: Level of NO2 pollution in Italian cities in 2020 compared to 2019.
Copernicus Atmosphere Monitoring Service
On behalf of the European Commission, the Copernicus Atmosphere Monitoring Service (CAMS) and the Copernicus Climate Change Service (C3S) use open and quality assured data about climate change and the atmosphere to create insights related to the COVID-19 crisis. CAMS created a website, including maps, time series, and interactive animations (see figure 5) to visualise NO2 and PM10 emissions for 50 major European cities. The data is based on satellites, ground observations, and numerical models and is updated on a daily and weekly basis. The use of the products created by Copernicus can be performed under the following licence. The website demonstrates the current European levels of air pollution and the effect the lockdown measures have on the quality of the air. Due to continual changes in weather it may be premature to draw conclusions from the data, however CAMS already detected a reduction of NO2 levels in Northern Italy since the lockdown, which can be found in this article.
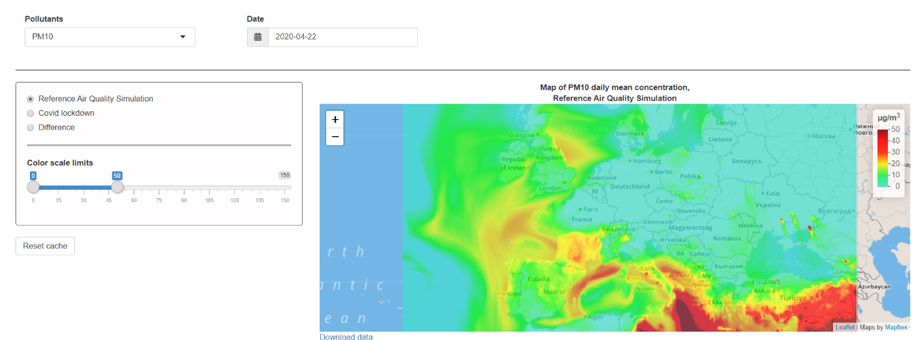
Figure 5: Screenshot of CAMS’ interactive map displaying the effect the COVID-19 lockdown has on air pollution.
The European Data Portal for COVID-19 editorial team created the graph below (see figure 6). It shows for every measuring point the average level of pollution over the previous 7 days to visualise the volatility of the pollutant concentrations. The graph shows that in April the observed amount of NO2 concentration in the air was halved compared to January. For the PM10 concentration a steady increase is observed over the last 4 months. PM10 mainly originates from natural sources such as bushfires, dust storms, pollens and sea spray, and is therefore more difficult to link to transportation.
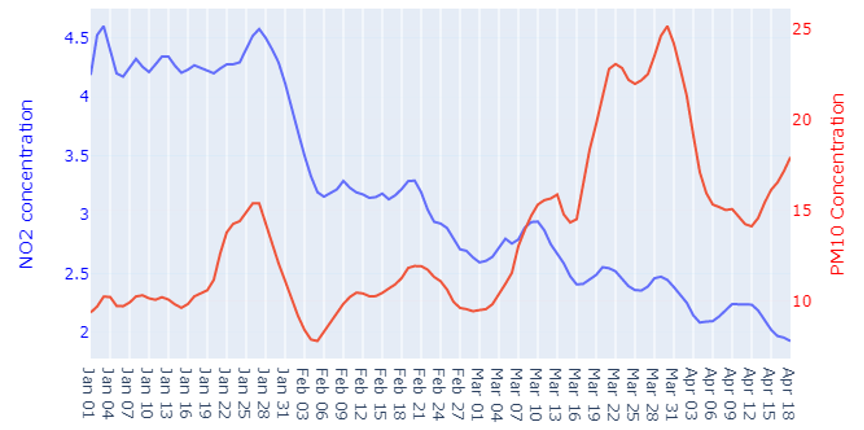
Figure 6: Pollutant concentrations across Europe – 7 day rolling averages.
Combining Traffic Data and Air Pollution data
To make the potential relationship between traffic reduction and air pollution more insightful, the European Data Portal for COVID-19 editorial team created an interactive visualisation based on the aforementioned datasets, shown in figure 7. It visualises the level of NO2 and PM10 particles across Europe over the last few months. For the same period, the amount of air traffic in Europe is shown, and as an example of road traffic reduction, the severity of traffic jams in the Netherlands is included. It is possible to use the time slider to navigate through the timeline. Overall, the data indicate that the reduction in air and road traffic are linked to the reduction in air pollution, and NO2 in specific. However, more data is needed to support this estimation. The data shown in the interactive visualisation and figure 6 were retrieved on 18 April 2020 and are not updated afterwards.
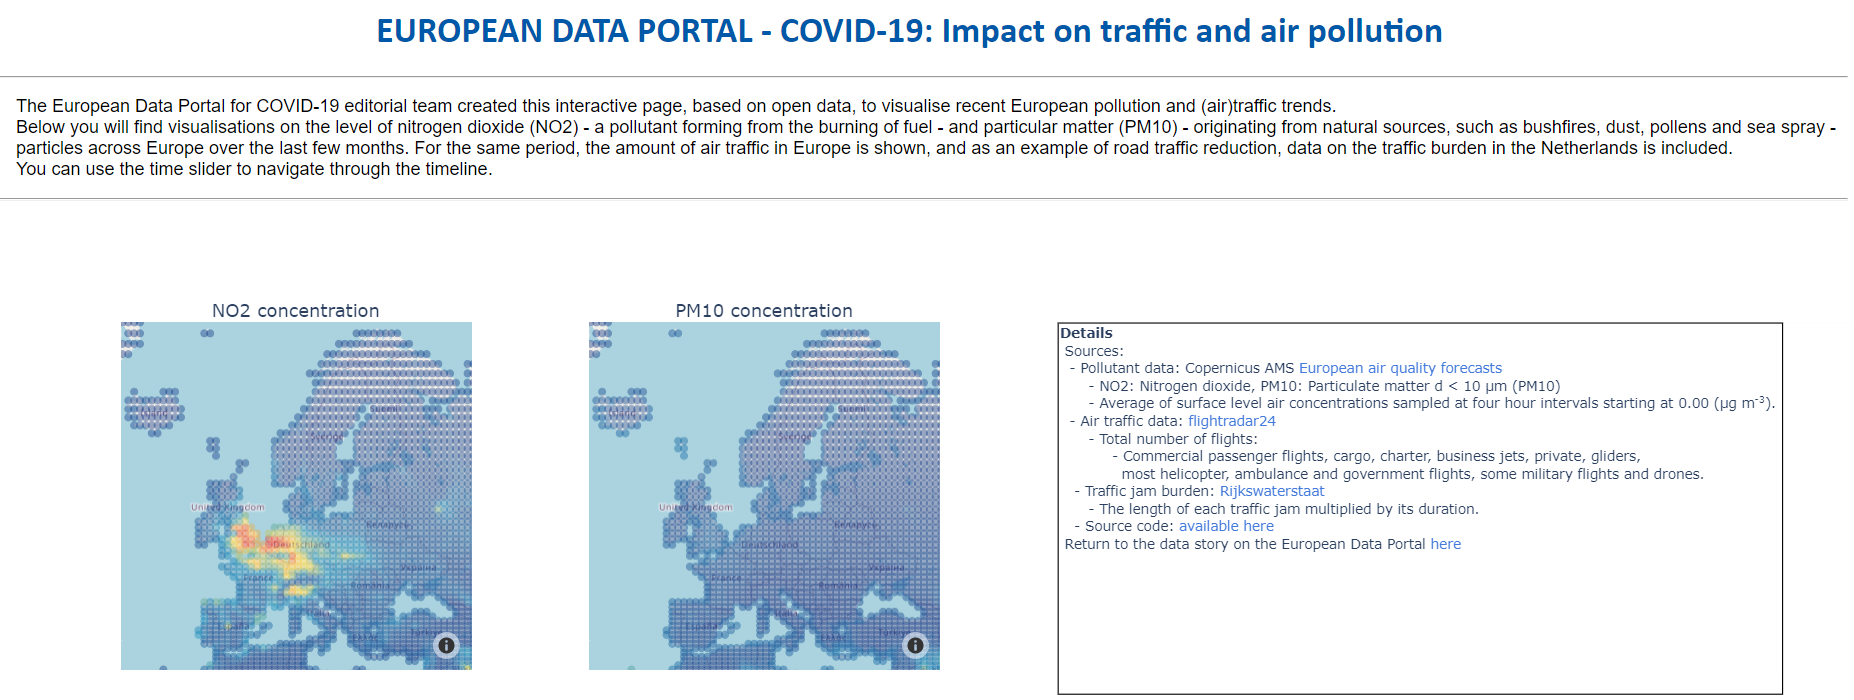
Figure 7: EDP for COVID-19 interactive visualisation of pollution data and (air)traffic.
Although these visualisations indicate a relationship between the traffic reduction and the improved air quality, it is important to note that more data is needed to conclude any kind of causal relationship. In addition to the traffic via the air and roads, Other factors may also influence the air quality, such as weather conditions like windiness. Furthermore, some recent insights, such as from Germany, indicate that the causality link may be more complex, since in some cities the NO2 levels did not drop during the lockdown.
As long as the restrictive measures continue, air pollution might remain relatively low, but if we go back to way it was, it is likely that the greenhouse gas emissions will return to their pre-crisis level. Moreover, several articles and scientists argue (e.g. UNCTAD, science business, and UN News) that a long-term positive effect on the climate is unlikely. Currently, climate change seems to be temporarily put on hold, as many climate-related international meetings are rescheduled, for example the postponement of the COP26 in Glasgow. Also, it is becoming less of a priority for policy makers as controlling the spread of COVID-19 and fighting against the upcoming economic crisis needs a more urgent short-term response.
Furthermore, an increase in greenhouse gases from other sources is observed. For example, the amount of landfill waste has risen due to cuts in agricultural and fishery export, suspension of recycling activities, the re-introduction of plastic bags and the increased amount of take-away food with single-use plastic. Due to the decay of this waste the level of methane (CH4), a greenhouse gas, is expected to rise. So, it might be questionable to truly speak of a silver lining for the environment. The long-term impact of the coronavirus pandemic on climate change will depend on how countries and corporations respond to this situation.
The data-driven insights discussed in this data story demonstrate that the air quality improved during this crisis, showing how resilient the environment is. Even though the positive side-effect of the governmental measures may only be of a temporary nature right now, it might encourage countries to reduce greenhouse gas emissions in the future. This crisis could also lead to societal changes, for example more people working from home and a better assessment about the necessity to travel to other countries for meetings. Two great examples how governments are already positively responding to the crisis are found in Brussels and Milan. In both cases, pedestrian friendly zones are created to increase possibilities for people to get some ‘fresh air’, while at the same time reducing traffic and pollution. For now, these measures are announced as temporary solutions, but maybe in the future these changes could become permanent.
By continuing to collect data on polluting activities and environmental aspects such as air quality, we can create a better understanding of the connection between them. Moreover, by following the trends in air quality from data initiatives and actively using the insights to adapt our behaviour, we might still be able to decrease humanity’s negative effect on the environment. The data discussed in this data story as well as related data from other sources, can not only help to create public awareness on air quality effects of the governmental measures in COVID-19 times, but also guide the decision-making of individuals, businesses, and governments on how things can be different in the future.
Looking for more open data related news? Visit the EDP news archive and follow us on Twitter, Facebook or LinkedIn.
